
Our next seasonal trade in the hog market is upon us. I feel a bit conflicted about this trade because I think the supply shrinkage due to African Swine Fever is creating a global protein shortfall. The long-term hog market delivery calendar is beginning to price this into the market as the December 2020 expiration has nearly regained November's decline, while the February 2020 contract, on which we'll be focusing, could make new contract lows over the coming weeks.
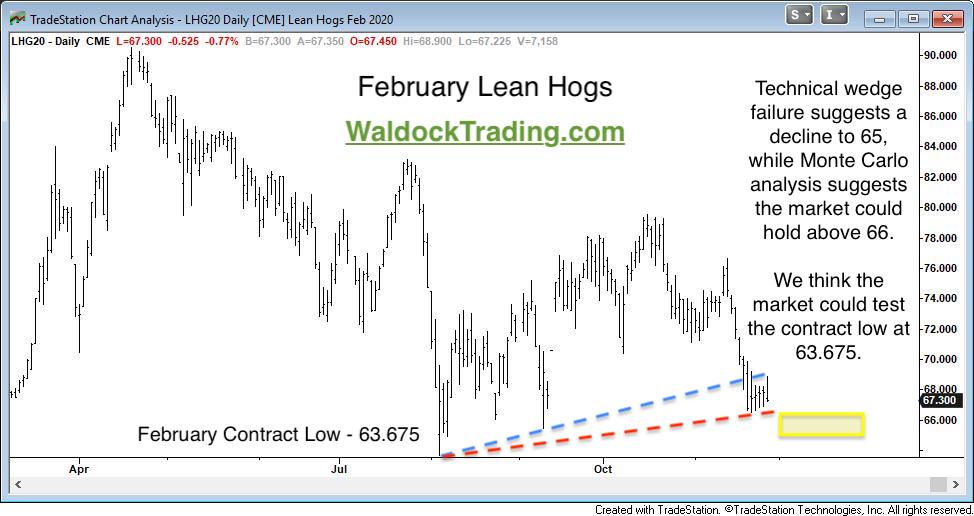
Let's begin with the February lean hog daily futures chart. We can see that the market has attempted three rallies this year in April, July, and October, all of which have failed. The speculative position reached its bullish peak position at the April high. This is typically a case of speculators being too quick to jump into a move that's expected to take months if not a year or more to reconcile as the hog market's supply, and demand goes through what is sure to be a titanic shift.
Now, the net speculative position is nearing neutral. We think one last flush may just clear the market and provide the reset for which we've been waiting. The current technical pattern and historical analysis of the expected seasonality both project declines, ending above the contract low of 63.675. We'll be watching closely to see how ugly this gets and advise accordingly.
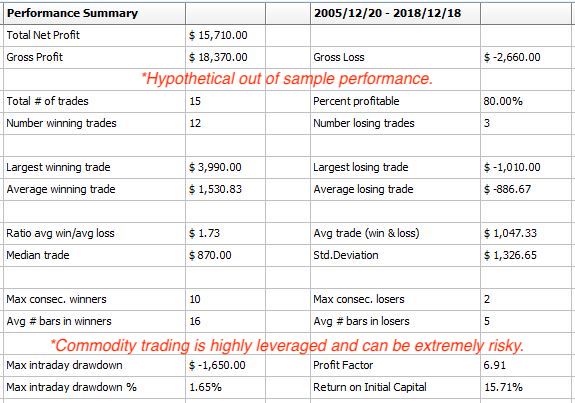
Our modeling has provided us with the following out of sample results for this trade. Remember, while results are out of the sample, they are hypothetical. Of course, every seasonal commodity trade we publish is based on hypothetical results because we run new programs for each annual opportunity to take into account current market structure and volatility. That being said, commodity trading can be risky, and even though we ALWAYS trade with active stop-loss orders, trading should only be undertaken with actual risk capital.
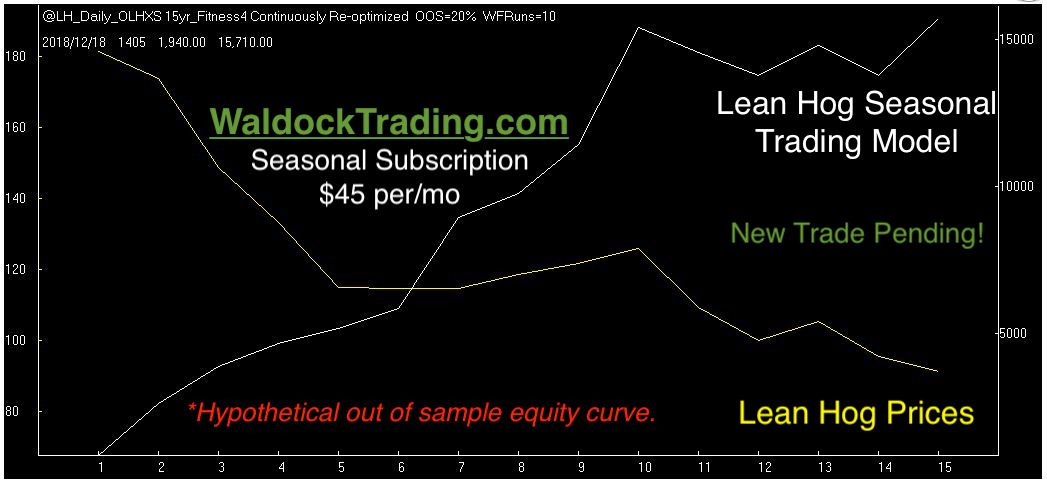
The hypothetical trade-by-trade walk-forward equity curve is next.
We always close with the Monte Carlo simulation data. As mentioned earlier, we build a new model with each trade. We do this to address the small sample size of an annual event. Since we can’t create more years, and seasonality 30 years ago isn’t the same as seasonality today, we focus on the last 15 years and allow the computer to randomize our entry and exit dates over a given range. We use this information to try and find the sweet spot of 100,000 tests.
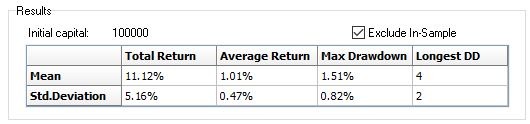
We can use the mean average return and standard deviation from the Monte Carlo test to determine some price projections and probabilities. First, remember that the percentages are based on the return to the account. Percentage returns have to backpedaled into futures prices. We can expect a decline of 1.01% on average, and there's a two-thirds chance that the mean minus one standard deviation will bind the decline. The calculations equal a drop of 1.48% or, $1,480, which is 3.7 points. A drop of this magnitude clearly puts the contract low within striking distance. We'll see what happens in the market when math meets emotions.
Subscribe to receive our sell signal, protective stop level, and position management commentary (including exit) once the trade is triggered.
See our Recent Trades.