The S&P 500 is making all-time highs ahead of the triple witching expiration of the underlying futures, futures options and cash options next Friday, June 17th. While this combination can be precarious in its own right, the fact that it comes two days after one of the most highly anticipated Federal Open Market Committee (FOMC) meetings in recent history could make it truly pivotal for the remainder of the year. This week, we'll focus on the S&P 500 and a combination of factors that could sustain a breakout in either direction based on the FOMC's actions or, inaction.
First, let's set the stage as this week's piece will be heavy on charts and short on commentary. Our point throughout this piece is to illustrate the current market's complacency and how that complacency is playing out through the Chicago Board Option Exchange's (CBOE) put option volume versus call option volume and the tremendous shift in positions between the commercial and large speculators within the Commitments of Traders (COT) report.
The put/call ratio measures how many put options are traded versus how many call options are traded. This can be measured many different ways. We'll be examining daily put option volume divided by daily call option volume as reported by the CBOE. The higher this number, the more fearful the market's participants are of the indices' decline. A value of 1 represents an even money bet.

The market hasn't seen the normal ebb and flow of volatility it has in the past. The more faith the markets' participants place in the ability of the First World nations to financially engineer new ways to kick the can down the road the lower these values go. The world of zero interest rate and negative interest rate policies are simply distorting the historical laws of economics. And here we are, headed into what could very well be the most volatile week of the year and the put/call ratio continues to dive!

Notice that even ahead of the June unemployment numbers and the weak non-farms payroll data, the put/call ratio had already begun to collapse. Our current reading of .87 is 28% below this year's average and 41% below the 10-year average. It's possible we'll see a build ahead of Tuesday's FOMC announcement but, given the current level, we see it simply as market complacency and lack of general interest. Notice how small the current commercial total position compared to recent quarterly rollovers.

This graph serves multiple purposes. First of all, notice the volume disparity between the full size and mini S&P 500 futures contracts. The mini contract is 20% of the full-size contract. The mini S&P 500 is clearly the dominant market but the full size contract must also be accounted for and the weekly Commitments of Traders report categorizes them separately. So shall we. Secondly, notice how small the current positions being held by the commercial trader have become compared to recent history. The average total position in the mini S&P 500 is a minimum of 10% below recent expirations. Finally, notice the current put/call ratio is now skewed to the bullish side with a reading of .87. We were nearly twice this reading last December. Now, let's move to the S&P chart itself.

The dashed lines represent the quarterly expirations going back to the end of 2013 on the weekly S&P 500 chart, above. There is a strong tendency for the commercial traders' net position to increase substantially immediately following the expiration of the quarterly options. However, more important to next week's market action is the flattening out of the commercial trader position ahead of the FOMC meeting. The commercial trader position peaked at net long around 228k contracts on March 25th. As of two weeks ago, that position had shifted into negative territory. Furthermore, the large speculators have become the primary buyers, to the tune of more than 190k contracts, over the same period. This leaves the large speculators exceptionally net long heading into next week.

The final point of complacency lays in general market range and movement. The S&P 500's declining volatility since the March expiration has been truly notable. The 14-week average range was near 84 points just three months ago. This equated to a weekly range just under 4.5%. This measure of volatility has declined substantially with the current 14-week average now around 44 points per week. However, due to the current higher prices, this equates to a weekly range of just over 2%. As you can see, volatility has declined and complacency has grown by several different measures.
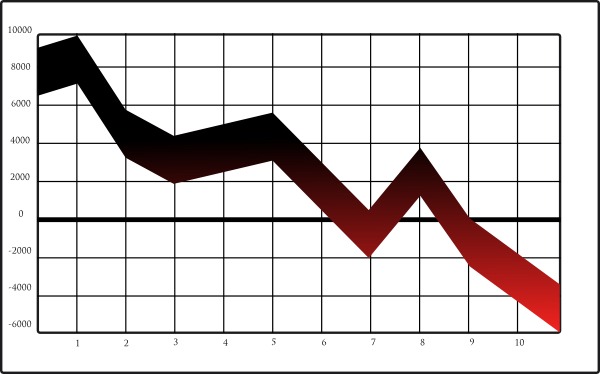
What does it all mean? It means that the biggest traders moving the biggest piles of chips have all cleared the table and are currently waiting on a new number. "Seven out. Pay the dont's" Their unwillingness to play ahead of the FOMC means there is a LOT of money on the sidelines waiting to pour in. The way this typically works is that we'll get a sell-off first, since the speculators are really long and have the most to lose. This will wash out much of their position as the market declines and the speculators bail. Ultimately, this puts the commercial traders in the drivers seat as they'll be likely waiting below to purchase the speculators' distressed sales. The associated increase in volatility that accompanies a sell-off will right the indicators we've been discussing. Their righting will help indicate a volatility-based bottom and the market will begin to climb. Either way, we won't be guessing, as we'll be following the actual trade signals quantifiably determined by the CotSignals approach. You'll see the S&P 500's performance in the last graph, below. The short side of this program is included in the sample portfolio, "Stock Market Hedge," certainly something to think about ahead of the most anticipated week of trading this year.