Andy Waldock developed his approach to seasonal trading by working with experts in their fields. We’ll walk you through a soybean example using parts of our Master Class on seasonality.
First, the disclaimer.
Everything I’m about to show you is for instructional purposes only.
I don’t know anyone’s financial or, market position. I’m not making any recommendations on any individual market or, financial situation.
Futures trading is extremely risky due to the highly leveraged nature of its contracts and may not be suitable for your investment objectives.
Commodity-based ETF’s may lack sufficient liquidity. Always do your homework.
Background:
First of all, when we say, “We know what’s going to happen” we’re referring to seasonality. We don’t know which crypto currency will be the next hot thing. We don’t know which meme stock will be subjected to the next short squeeze. We DO know that crops are planted in the spring and harvested in the fall…EVERY YEAR. We also know that gasoline demand rises around Memorial and Labor Day weekends. Therefore, in a very general way, we DO know what’s going to happen, when it’s going to happen and what market returns these events have produced in the past.
Now, it’s very important that we focus on the cause of these events. Computers can easily find a series of years and dates within many markets that show an annual pattern. However, without some fundamental force, it’s a case of random curve fitting and cannot be projected into the future.
Let’s look at a soybean example.
When trading futures, it’s extremely important to choose the proper dataset. Commodity futures have expiration dates. For example, the coming year’s soybean crop will be reflected in the November soybean futures. Soybean futures are deliverable against multiple expirations and as these contracts expire, their price histories get linked together to build historical data series. There are a couple of key differences that show up depending on how these contracts are grafted to one another.
Look at the differences in the following soybean data.
Contract Issues with Historical Soybean Data
Most commodities are priced higher the farther out the expiration is. This has to do with storage costs, insurance and fears. TradeStation’s continuous data feature adds value to the expiring contract to catch up with the coming contract’s elevated price. The problem is that this creates artificially high prices that never actually traded.
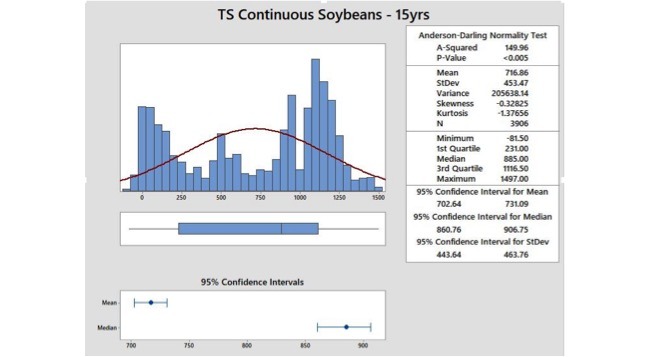
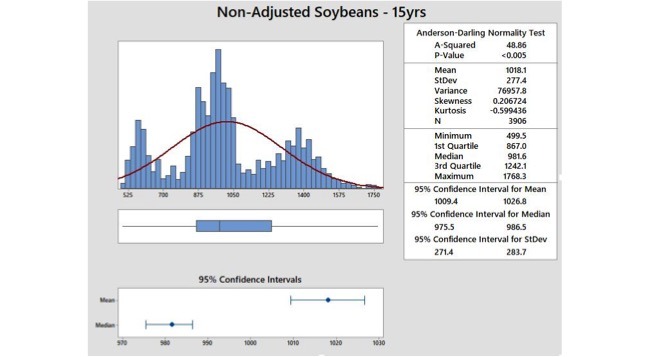
When it comes to seasonal trading, the best dataset is ratio adjusted. Ratio adjusted data averages out the difference in prices while keeping the percentage moves correct. Keeping the percentages intact allows us to manipulate the data as necessary between platforms when developing a strategy.
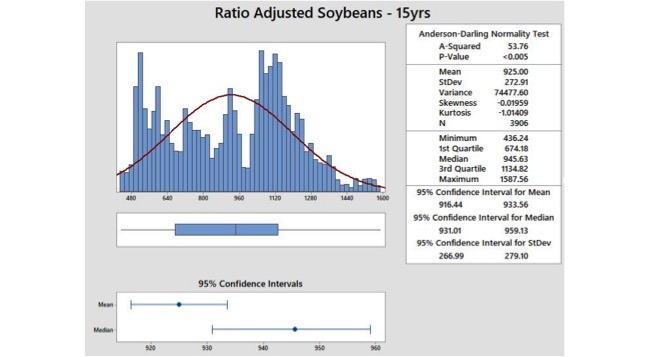
As you can see from the plots, the shape of the historical data differs considerably depending on the data construction method employed.
As you might expect, the seasonal plots generated also differ considerably.
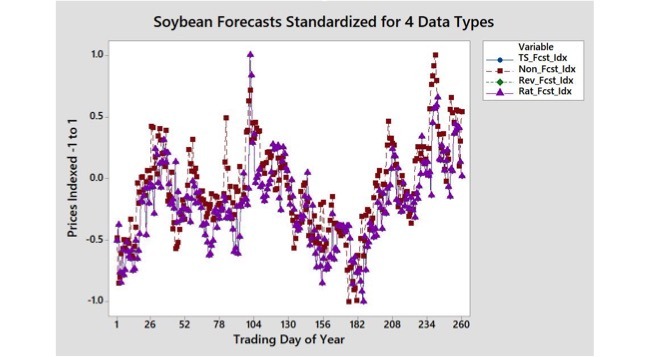
We use ratio adjusted data because it lets us determine the relative move in percentage terms. We can then reverse engineer the percentage moves into current market prices and volatility.
We then use this data to formulate a forecast. First, in a quirk of MatLab, note that the pattern is inverse. Therefore, the trough seen around the 182nd trading day is actually the late summer peak.
The stability of this pattern creates the following thesis:
Soybean prices tend to peak around the 182nd day then, fall for the next 25 sessions. Now, using some calendar functions, we can determine that soybeans peak around September 13th (day 182) and fall through October 18th (day 182+25).
Once I’ve identified a window of opportunity, I start plugging the dates into the seasonal code I had written by Tradestation wizard, Stuart Okorofsky. Using the walk-forward optimization option within TradeStation, I generate a window of possible outcomes to determine how stable the seasonal inefficiency is.
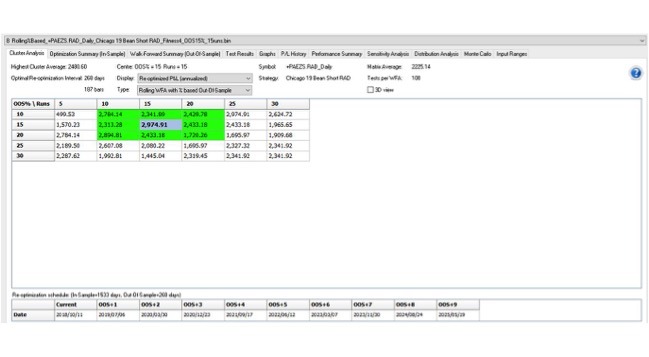
There are other tests we run in conjunction with TradeStations Walk Forward Optimizer’s cluster analysis but, this provides a quick visual of the type of stability for which we’re searching.
We’ll provide the description for one last bit of testing. Then, if you want more, you’ll have to go through the blog or feel free to contact me directly.
The problem with seasonal trading is that there is very little data with which to work. This problem is exacerbated when the data is split into in-sample, out of sample, and blind data. Therefore, we use bootstrap with replacement walk forward optimization to generate statistically valid results from smaller sample sizes. We then subject these results to Monte Carlo simulation which reorganizes our variable 1,000 different ways. We use the Monte Carlo analysis to determine the risk to reward ratio.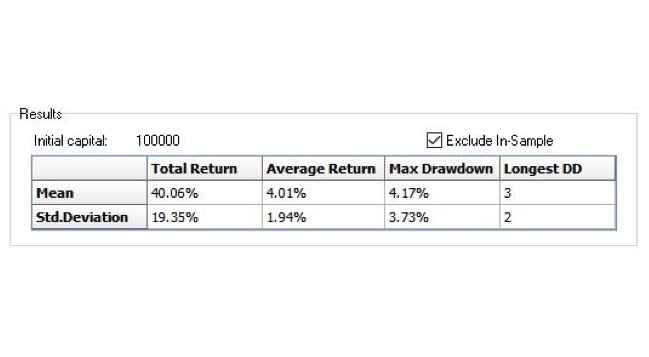
Monte Carlo analysis helps determine the overall risk to reward profile.
When we look at the Monte Carlo results, we’re ideally looking for an average return that’s more than double the standard deviation of those returns. Basically, this means that even if it underperforms, there’s a good chance it’s still a winning trade.
That should provide a solid foundation on how we generate our seasonal analysis. Obviously, there’s more to it than this. As you know, we also calculate price projections, stop loss values, and a time target.
Some of our partners.
Murray Ruggiero – Murray has been a wealth of information, guidance and encouragement. Twenty-five years ago, his book, Cybernetic Trading Strategies blew me away. I’ve been very fortunate to get to know and work with him. Virtually everything I do has his fingerprints on it in some way, shape or, fashion.
Dr. Darrin Hanna – Darrin is probably the smartest person I’ve ever met. I say this in part because of what he knows. I also say this because he’s taught me more than I ever thought I’d know and that makes HIM a genius.
Peter Zwag – Peter is the developer of the GSB platform. He’s revolutionized the way we harness computational power to comb through tremendous amounts of data from the luxury of our homes and on our own schedules.
Stuart Okorofsky – Stu is a programmer extraordinaire who’s turned the data findings, logic and rules into deployable, automated Tradestation algorithms. Stu can also adapt these strategies to Ninja Trader and other languages.
Tradestation – I’ve been using Tradestation since it was SuperCharts and still use Tradestation to write, test and deploy my algorithms on a daily basis.
GSB – Genetic System Builder is run by Peter Zwag in Australia. This is the platform I use for the development of day trading algorithms. There are many things this program does well but the real boon is the GSB users network, which shares computational power across users. This makes development extremely fast without having to buy a lot of fancy hardware.
MatLab – This is the program I use for support vector analytics and deep diving data.
MRCI – Moore Research is the industry benchmark for seasonal data.
SeasonAlgo – This is an Italian provider of seasonal data, which I cross reference against MRCI.

