

The gold market is currently displaying setup with a very good risk to reward ratio as well as the potential to set the stage for the coming year's trade.
The Setup:
I've been watching the gold market for the last couple of weeks because it has a tendency to make a significant low heading into the new year. However, the market's technical action never triggered a buy signal. This is also a good example of why I don't take trades based solely on seasonal analysis. Now, the market setup is a bit more to my liking.
The gold market has been consolidating since 2020. The market has made a series of lower highs and higher lows. Once the trendlines are drawn in, the contracting volatility becomes obvious. Take a look at the weekly gold chart, below.
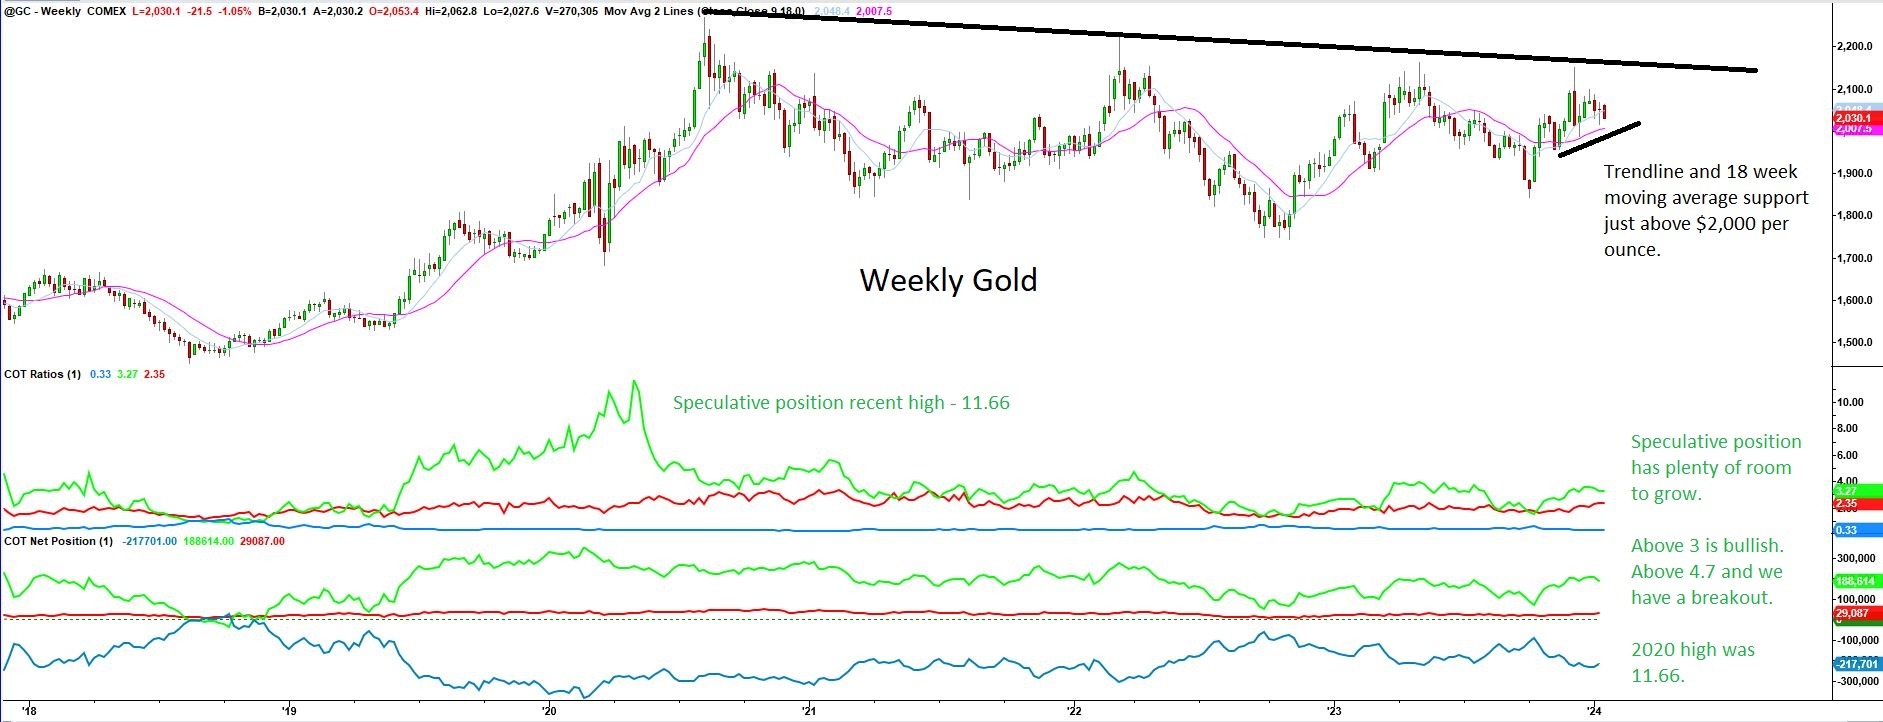
The Chart:
The green line on top represents the net speculative position. Currently, speculators hold more than three long positions for every short. When speculators start to drive the market higher, this ratio climbs above five. Historically, when the speculative position reaches "gold fever" we'll see their position concentration climb above 10:1.
Speculative traders love cheap prices and I expect them to add to their position as the market rests on weekly technical support levels.
The gold market's recent decline can be see more readily on the daily chart, below.
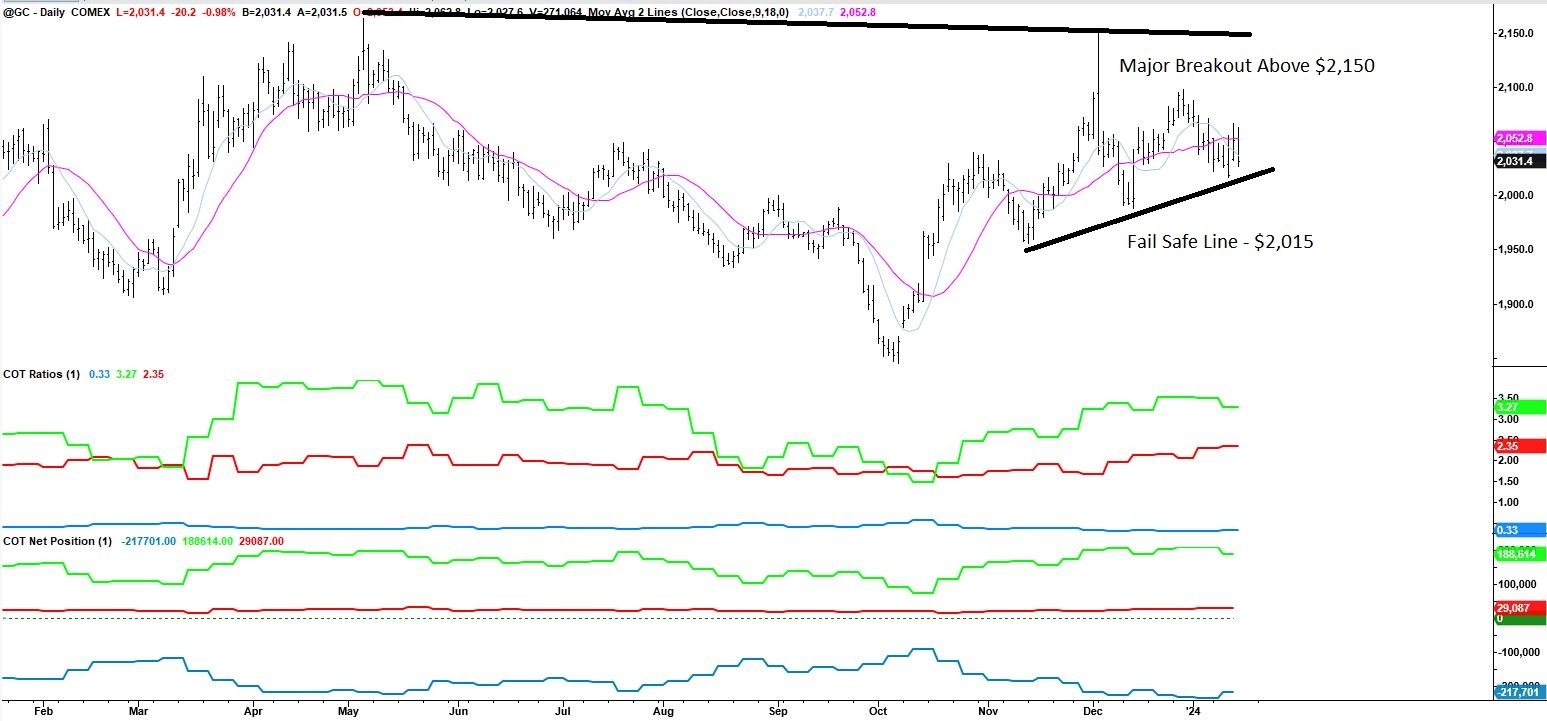
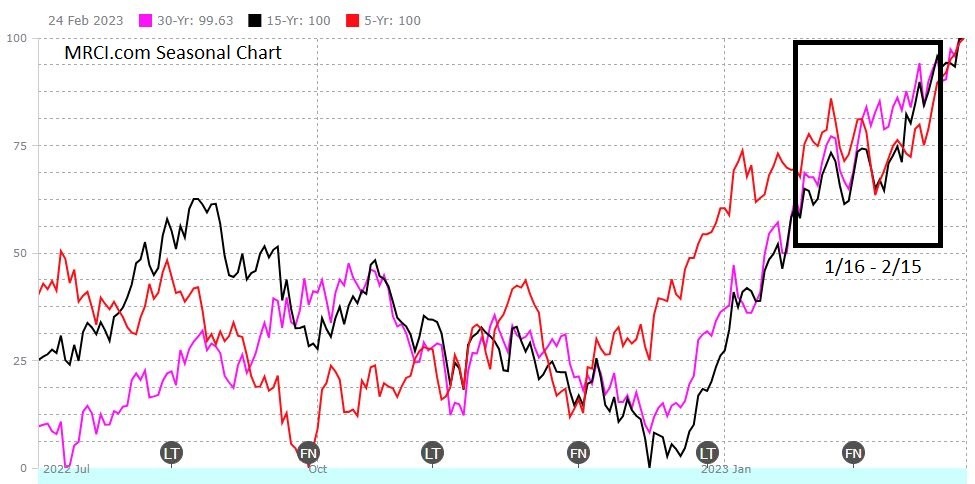
I'm not a gold bug but, I recognize a tradable opportunity when I see one. The gold market is forming an inverted head and shoulders pattern that trigger a significant move higher. I'll use the market's technical support to hold and assume the seasonal move higher is simply running a week or, so behind schedule. Typically, the market moves sharply higher from early January through the end of February. Notice the outlined area on the seasonal chart provided by mrci.com, below.
As Low as $50 per month!

The Trade:
I believe the combination of technical support, neutral speculative trader's position and strong seasonal influences will combine to hold gold prices above $2,000 per ounce over the next couple of weeks. Furthermore, if this rally materializes as expected, there's a solid crack at testing the overhead consolidation more than $100 per ounce higher. That's nearly a 5% move in an ETF like "GLD" or the double leveraged Pro Shares fund "UGL" and more than $10,000 per futures contract.
As always, watch your risk, and let's see how this gold trade develops over the next couple of weeks.


