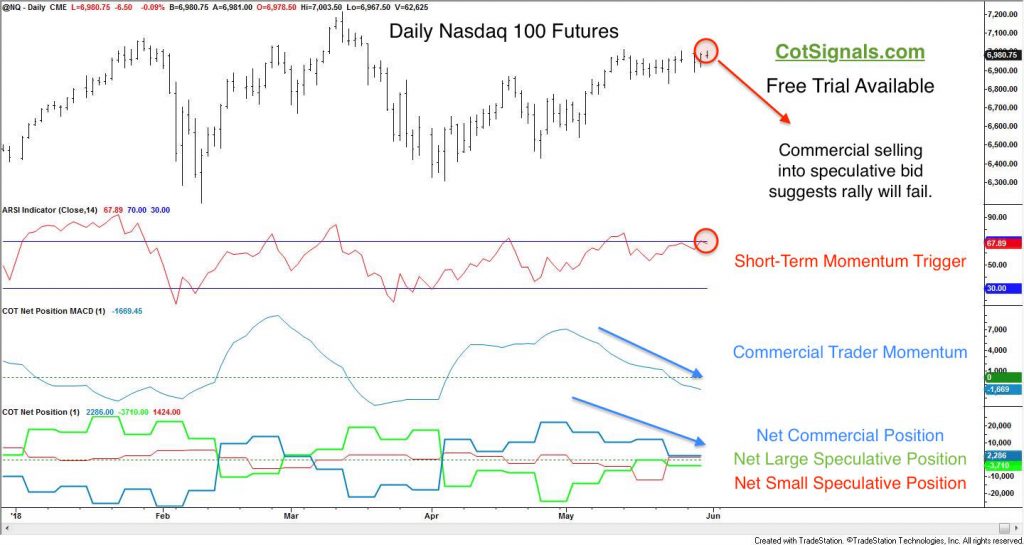
We've been writing about the largest traders' growing short position in the S&P futures. In fact, they've been net sellers in seven out of the last eight weeks. Let's face it, size matters. The mini S&P 500 futures are the most liquid of the stock index futures and therefore present a much larger capital base. Now that the selling has spilled over to the other indices specifically the Nasdaq 100 futures we're calling for an outright short sale.
Meanwhile, commercial traders in the Nasdaq 100 futures have been net sellers for three of the last four weeks. This has driven the commercial traders' momentum into negative territory while Memorial Day Tuesday has provided us with the rally we'd like to sell.

I frequently discuss my trading style as trying to line up as many dissimilar factors as possible to create a robust trading plan. This is where we shift gears from our Commitment of Traders (COT) analysis to our seasonal study. We've found greater success combining multiple market disciplines than leaning on any single area of research. The details behind the calculation of our seasonal analysis are beyond the scope of this article. However, the broad brush stroke analysis suggests the Nasdaq could be considerably weaker with relatively little risk over the next couple of weeks. Therefore, we feel that the Discretionary COT sell signal comes at a fortuitous moment in time. Finally, the Discretionary COT Signals are meant to be a short-term swing trading mechanism with most trades lasting less than a week. However, given the size of the imbalance between the commercial and speculative positions across the stock indices and the seasonally week period we're approaching, we feel this trade could be part of a substantial move lower.
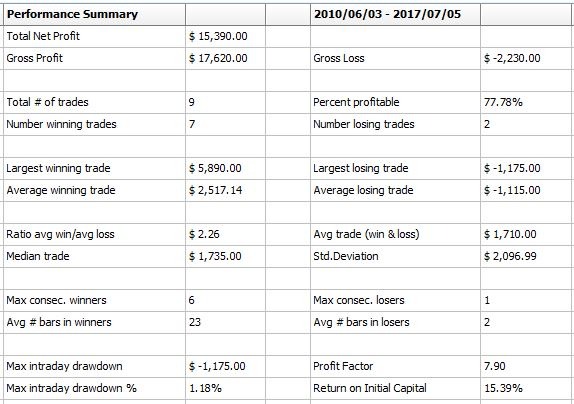
Let's look at the seasonal performance table from our out of sample testing. Remember, past performance is no indication of future profits, and every investor should determine the suitability of the investment vehicle before placing any actual money on the line. That being said, I trade my recommendations...including this one.

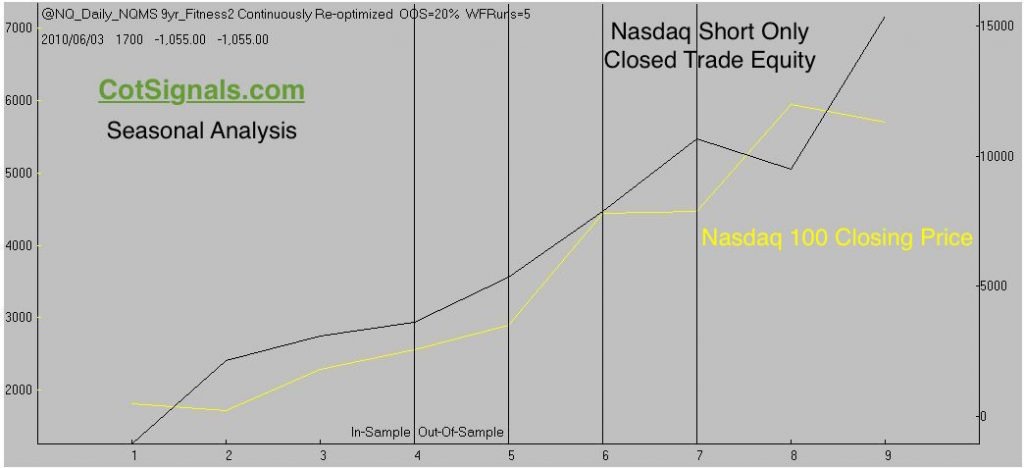
One of the most surprising finds in my seasonal research is the way these algorithms can pick consistent moves even when they're decidedly counter-trend. The Nasdaq has screamed higher for almost ten years yet, the equity curve below is based on short trades only from this time of year.

*Past performance is no guarantee of future profitability.
One of the problems with the seasonal analysis is the lack of data. This makes proper in/out of sample testing a bit tough. We canvas the windows pretty thoroughly both forwards and backward, and through different methods. No matter the input, we always move towards a comparison between in and out of sample testing. We're not looking for the biggest trades or, to be right on every trade. We hope to achieve the repeatable consistency of a pro bowler or, golfer. We employ Monte Carlo testing using the bootstrap with replacement methodology to verify the consistency of our testing. This leads to the results, below.

This test is the result of 1,000 walk forward runs. One of the interesting points is the average return column. The mean is more than twice the standard deviation. This means that 95% of the trades should create a profit between 1.3% and 3.32%. Based on the $100k account size used in the calculations, that equals an expected profit between $1,300 and $3,320. Most importantly, our risk for the trade is only 1% above the opening price, once the trade is triggered.
We have five more seasonal trades we'll be looking for confirmation setups on this month. If you like the idea of multi-factor trade confirmation and believe in the statistical repeatability of seasonality, look us up.


