

The Canadian Dollar has been trading sideways for the last month. Closer inspection reveals a shift in big money's bias ahead of a predicted window of seasonal strength. We monitor bias through the Commodity Futures Trading Commission's (CFTC), Commitment of Traders (COT) report. The government provides this report which separates the commodity market's players into a few key categories. While we've yet to determine whether the big money's trading is the cause or, the effect of seasonal analysis, the correlation between the two is undeniable. We'll explain how we use this analysis to create nightly trading plans with the current setup in the Canadian Dollar.
We focus on the commercial and speculator categories of the COT report. This separates the commercial traders, those with a business model attached to the underlying commodity, from those hopping in and hoping for a profitable ride. I've used the battle between these two groups as the basis for my swing trading since leaving the floor more than 15 years ago. Speculators seek trending markets while commercial traders' actions are based on a mean reversion business model. Commercial processors scale into trades buying more as the market falls while producers sell more as the market rallies. Declining prices in the underlying commodity create opportunities for processors to buy future inputs at a lower cost while rising prices create an opportunity for producers to sell their anticipated forward production at more favorable prices. Remember, markets are only trending about 20% of the time.
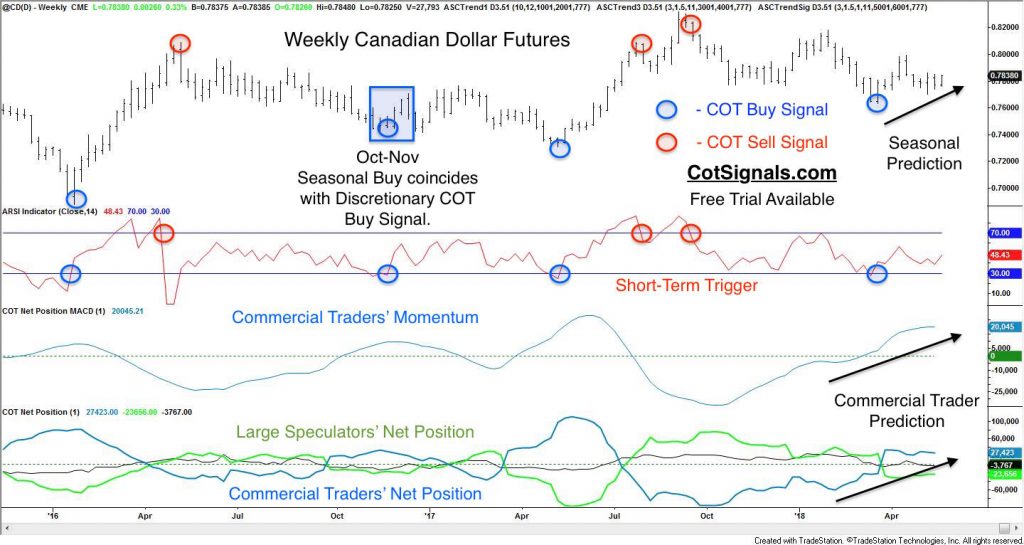
The trading rules are the same for both the daily and weekly method. First, we only take trades in line with the commercial traders' momentum. We want to put the commercial traders' analysis and wallets behind our trades. However, we don't have the time, pocketbook or, business interest required to simply track their positions. Therefore, we wait for the speculators to drive prices against the commercial traders. In this case, speculators have driven prices low enough to push our short-term trigger into oversold territory. Pushing our exclusive version of RSI into overbought or, oversold territory opposite the commercial traders' momentum sets the trigger. Finally, once the market reverses to move in the commercial traders' predicted direction, we enter the trade and place a protective stop at the recent swing high or, low.
We'll begin with the weekly chart setups.
I learned to trade in the S&P 500 futures pit through the 1990's. Long-term trading is never going to suit my personality and, I've traded long enough to know that the strategy has to match not only the market but the trader's psyche as well. Therefore, I distill the broad actions above into a nightly swing trading worksheet for most domestic commodities. We offer a free trial for this product because it is a methodology. The swings have to match your tempo. This is our most sensitive product and typically catches swings from three days to two weeks long. The daily chart below will provide a much better feel for the type of moves I've created this to capture. Just remember that we intend to take profits as the speculators are forced out of their positions.
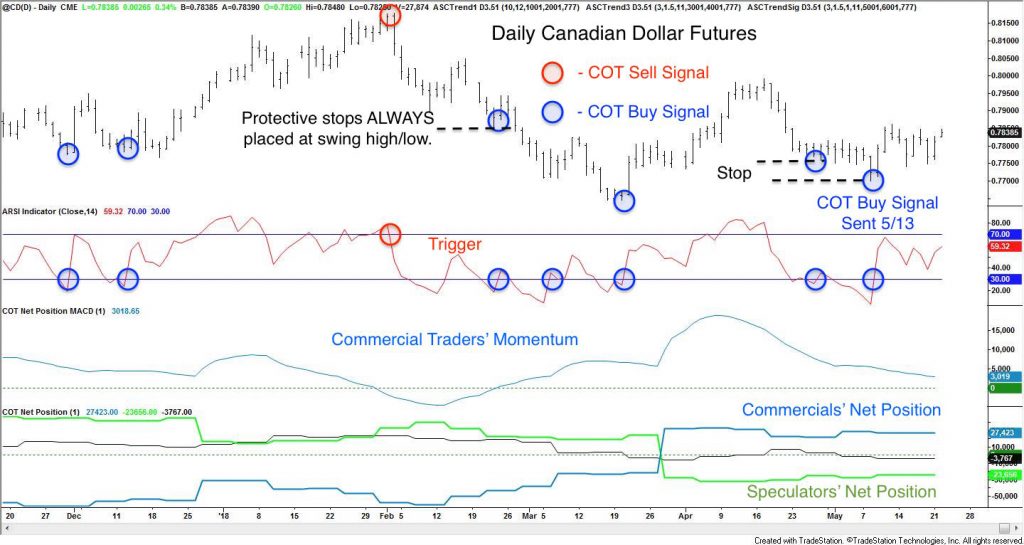
You can see that this method doesn't waste much time making decisions; both the winners and losers happen pretty quickly. The Discretionary COT Signals are based on daily data for the nightly email. Daily data provides ample trading opportunities for active market participants looking for a swing trading edge.
Next, we move to confirmation via seasonal bias. Ideally, we put as many factors as we can on our side before we put our money at risk. Commercial traders have been heavy buyers ahead of a seasonally strong period in the Canadian Dollar. We combined multiple data forecasts into the seasonal model, below. The seasonal model is created as a stand-alone strategy and is available separately from the COT analysis. I'll continue to trade multiple models alongside each other until an all-knowing trading genie materializes. One of our significant adjustments to typical seasonal analysis is that we place protective stop orders that allow us to sleep comfortably at night rather than the usual, "disaster" stop that is seen in many places. In fact, we're only risking 1.25% from our entry price, once the trade is triggered.
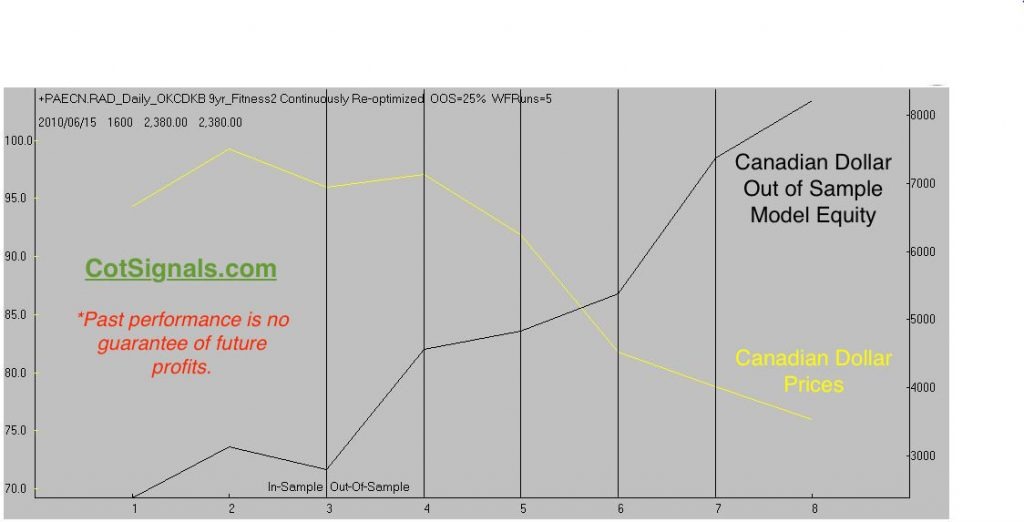
The unique thing about the seasonal algorithm is its ability to find repeatable pockets of strength even in what has been a declining market. Look at the long-only strategy equity in black versus the closing price of the Canadian Dollar in yellow.
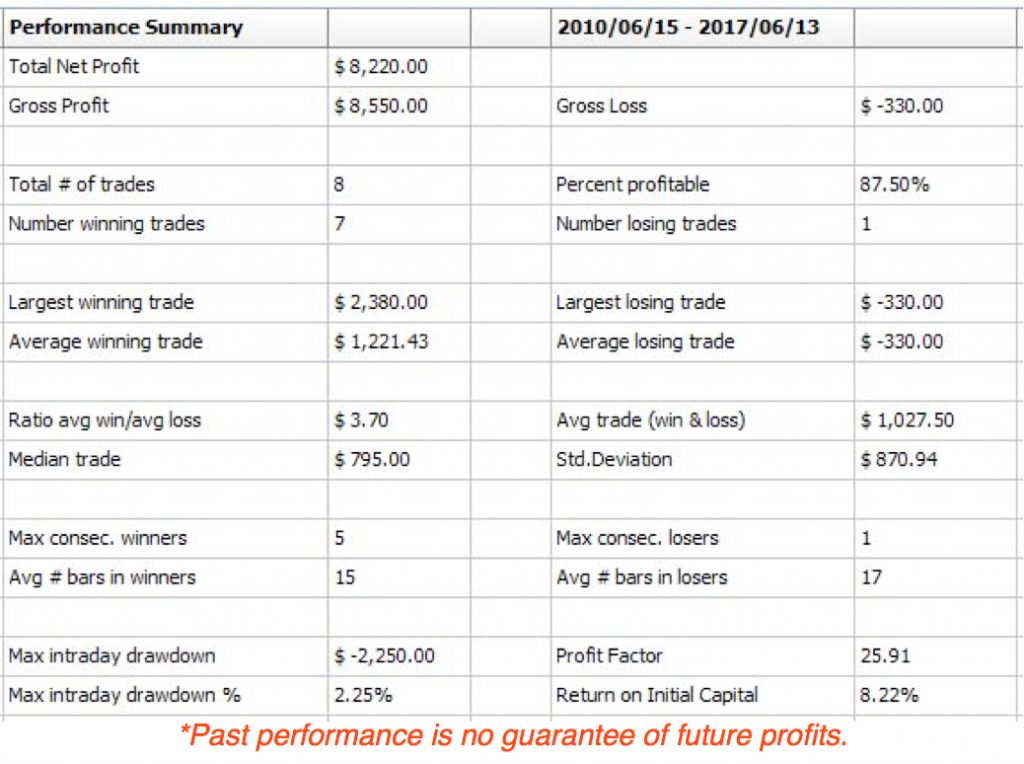
Finally, here's how you use Monte Carlo analysis of the strategy to predict expected market movement. First, use ratio adjusted data. Ratio adjusted data is the best solution for handling expiring contracts and the associated splicing of contracts required to generate a single stream of data. Once the data is run, the results look like the Canadian Dollar metrics, below.
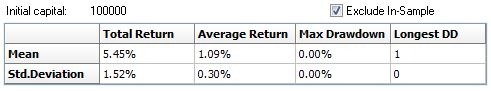
Note that we set the initial capital to $100k to make the percentage extrapolations simple. The average return of 1.09% equals 109 points in the September Canadian Dollar futures contract. Face value for this contract is also $100k, and it has a tick value of $10. Therefore, 109 points equal an average trade of $1,090. I've also included $100 slippage and commissions in these calculations to make them more realistic. Remember, I'm trading this as well. The risk to reward over time is precisely the type of opportunity for which I look. The margin is only $1,210, and the risk is about $980. History suggests I have a good chance at making nearly 50%, counting wins and losses, per $2,200 investment over just a few weeks.
Trading isn't meant for everyone, follow along. Ask questions. See our results. See how I do it.


