The last trade in our March seasonal portfolio is in the May crude oil contract. We expect the petroleum rally to continue. Our seasonal program will most likely trigger a buy signal Sunday night. This will make us long both crude and the RBOB unleaded contract. We'll carry both of these positions through next week when we'll offset the unleaded. Then, we'll be long just the crude oil through its exit, the first week of April. Obviously, these are highly correlated positions, and risk should be treated accordingly.
We've discussed the record-setting imbalance between the speculative and commercial trader positions in the crude oil market both here, and in our Commitment of Traders column for Modern Trader magazine. We got a washout of 13%, which I was expecting. However, it did little to shake the speculative bid. Crude oil's rapid rebound has emboldened the speculative buyers, whom we now expect will push crude oil above the January high at $66.02 for the May contract. In fact, this model projects a top near $68.25 with nearly 70% accuracy. This fits perfectly with a macro scenario that sees the oil drillers' forward selling capping prices under $70 per barrel.
Now, the nitty-gritty.
Crude oil margin is currently, $2,310. I do expect this to rise as volatility increases.
We will use a dynamic sell stop to protect this long position. Therefore, the risk will change daily and may exceed your initial trade plan's threshold. We'll be trailing a protective stop two average true ranges behind the previous day's close. This has yielded a maximum loss of just over $3,000 in our testing and a projected initial risk of $2,600. The six-month high and low for this calculation is $6,040 and $600. The average loss in our testing has been just under $1,700. Remember, there is a 1/2 size mini-crude oil contract, as well.
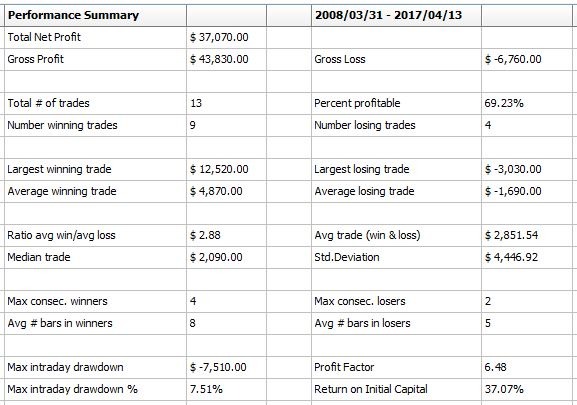
Out of sample performance, figures are based on a full-size contract and a $100,000 starting balance with $100 deducted for slippage and commission to make the math simple.

Combined Seasonal Performance History
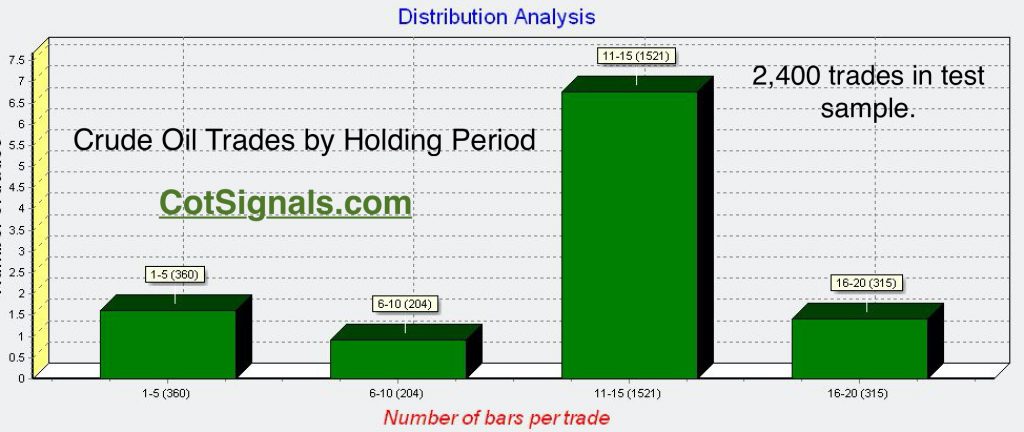
This is expected to be a quick hitter with only eight days in the average winning trade. This is partly due to the trailing stop and partly because the algorithm adjusts the number of days in the holding period. For example, there were only 6 bars in the program's largest winner while each of the last three years had holding periods in the teens. We've posted the test sample trade distribution by the number of bars in the market, below.

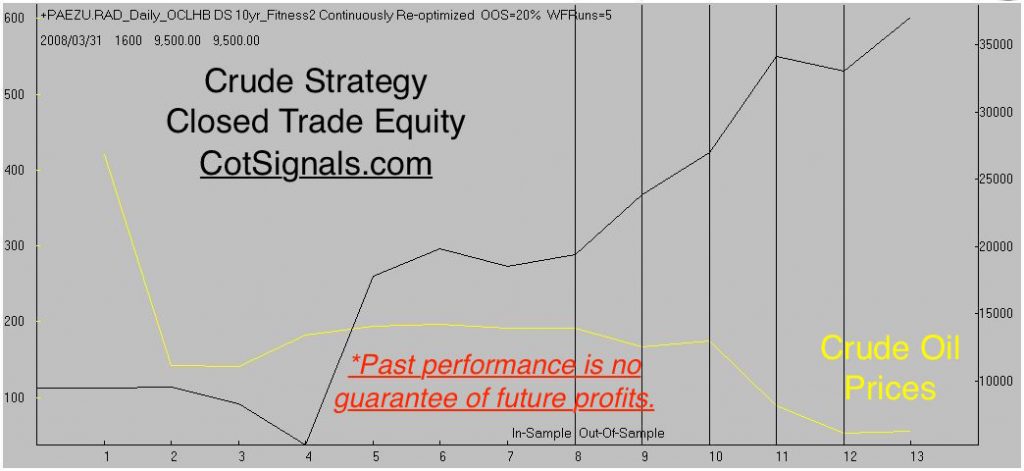
The x-axis breaks the number of trades into quartile holding periods. The y-axis plots the average profitability for the trades in that holding period. There are two distinct takeaways from this chart. First, all quartiles are profitable regardless of the days held. Second, the quartiles are also a good indication of the ebb and flow of the market's movement. The first quartile is profitable on an initial move in our anticipated direction. The second quartile, while profitable, shows evidence of the market's pause before surging towards its most profitable period. The last quartile shows characteristics of a move's waning strength. Finally, it's important to note that this test covers the previous ten trading years, which has been brutal to crude oil prices as you'll see in the equity curve plotted over crude's closing prices, below.

Finally, we'll close with the Monte Carlo analysis. The overall performance of this strategy has been very efficient in testing. The average annual return is more than three times the yearly return's standard deviation. While this has no impact on success, it shows that the model has consistently generated significant risk-adjusted gains, which are not the result of a couple of homerun trades.

Expect an email Sunday or, Monday with the official entry signal. We'll also send nightly emails updating the dynamic stop-loss order until we exit the trade.


