

We've discussed the growing speculative bubble in the stock index futures both on our blog and in Modern Trader magazine. The market's 10% flush has wiped out much of the speculative money. It will be another week before we can run the Commitment of Traders data and quantify our suppositions accordingly. We expect this washout to reset the deck and put the commercial traders back in charge of the bid. In fact, we intend to buy in at the currently discounted prices along with the commercial traders.
First, one might ask, "Who are the commercial traders in the stock index futures?" The commercial traders in the stock index futures are the banks and money managers using the stock index futures to manage the money they run based on the underlying holdings of the given index. Stock index futures allow money managers the ability to adjust exposure without offsetting stock positions and creating the associated tax issues. Furthermore, the leverage employed by the future markets allows them to maintain a more fully invested position in the underlying stocks. Currently, the mini DJIA futures contract has a margin requirement of $4,620. The cash value of the index is $125,000 with the Dow futures trading at 25,000. Even leveraged ETF's don't supply that type of leverage. Finally, stock index futures can be sold short with abandon. This allows them to hedge their downside without having to account for the uptick rule on stocks and remember, short selling of stocks was banned during the '08-'09 meltdown.
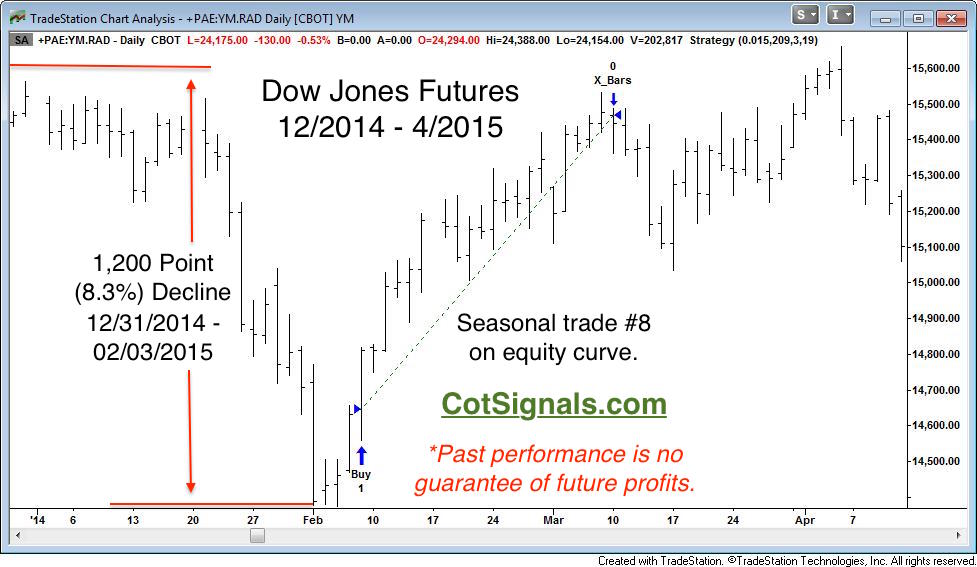
Our seasonal model has targeted a portion of February beginning late this week or early next, to be exceptionally strong. We've been waiting anxiously to see if we would be buying into a stock market that was going exponentially higher beyond rationality or if we'd get a pullback to buy into. The meltdown should shake the speculative bid. In fact, this could turn out to be a very 2014 situation when the speculative bid was flushed out post-January Effect only to see the commercial traders propping up the bottom and buying with both hands as they knew it wasn't quite time for the cycle to be over.
*Past performance is no guarantee of future profits.
Speculative traders had built up their largest position in nearly two years on the Dow's march to the top. The decline between late January and early February forced out two-thirds of the speculative bid. In fact, overly anxious speculators shifted to net short during the first week of February...just as the market bottomed.
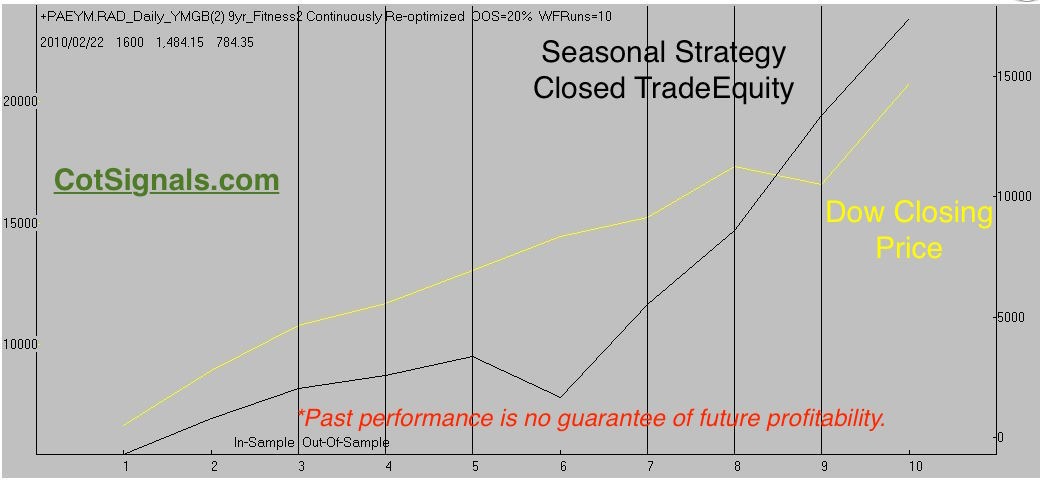
The model we've selected has produced the out of sample results seen on the equity curve, below.
*Past performance is no guarantee of future profits.
Recent volatility caused me to go back through the trade history to determine how many of these trades occurred in a similar high volatility environment. That's how I identified the 2014 setup we've already discussed. This is important because we use percentage based stop losses. This caps our risk level in a way that volatility-adjusted stop losses can't unless they have artificial constraints thus, bastardizing the concept, to begin with. Fortunately, I found very little correlation from setup to setup. I broke the trades into three categories, trending, reversal and, sideways. The performance was roughly equal across with the logical exception of the reversals capturing the biggest total wins. The short version of the long story is that we're sticking with our forecasted risk parameter of 1% from the entry price for this trade. The protective sell stop will remain in place until it is hit or, we take profits in a couple of weeks.
*Past performance is no guarantee of future profits.
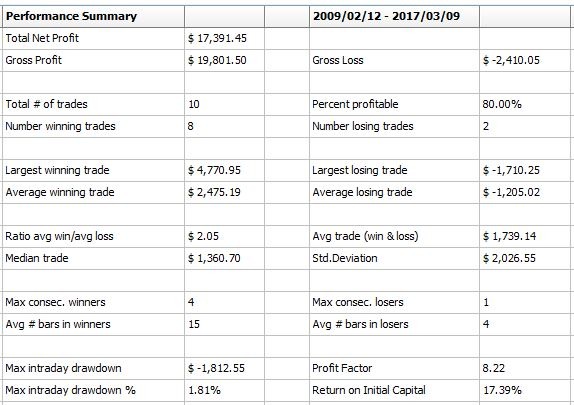
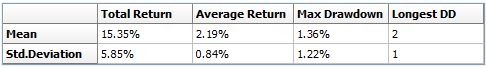
Finally, we'll discuss the Monte Carlo results and our expectations. The mean return for this trade has been about 2.2%. This includes wins and losses. The average winning trade has been about 500 points. Factoring in the first standard deviation gives us an upside target cap around 750 points. I'm making a special note of this in case we get the opportunity to potentially scalp some alpha off this position using the options markets.
*Past performance is no guarantee of future profits.
Now, as I sit here, I've seen the Dow trade within a 700 point range. I've no idea where we'll be trading when this signal is actually published. The one thing I do know, is that the speculators have been flushed and the stock indices are ready for the commercial traders to resume their control over the market while leaving the speculators on the sidelines marveling at their own hindsight and what could've been.
{Update - we bought Dow futures on the open for 02/07/2018's business}
If you'd like to have this trading signal {sell stop and exit} delivered to your email box once it's published late this week or, early next week, sign up for our seasonal analysis.
Seasonal analysis Subscription $35 per month.
Australian Dollar and crude oil trades yet to come this month.


