Speculators are approaching the new year with an eye towards stock market gains and a tightening Federal Reserve. This is a tough combination for interest rate futures to rally against. However, commercial traders are holding their most bullish position since last April. Therefore we expect the decline in interest rate futures, specifically the 10-year Treasury Notes and 30-year Treasury Bonds to be a temporary effect of speculative exuberance, and for interest rate futures to rally through the end of the month as the heavily short speculators are forced out of their positions.
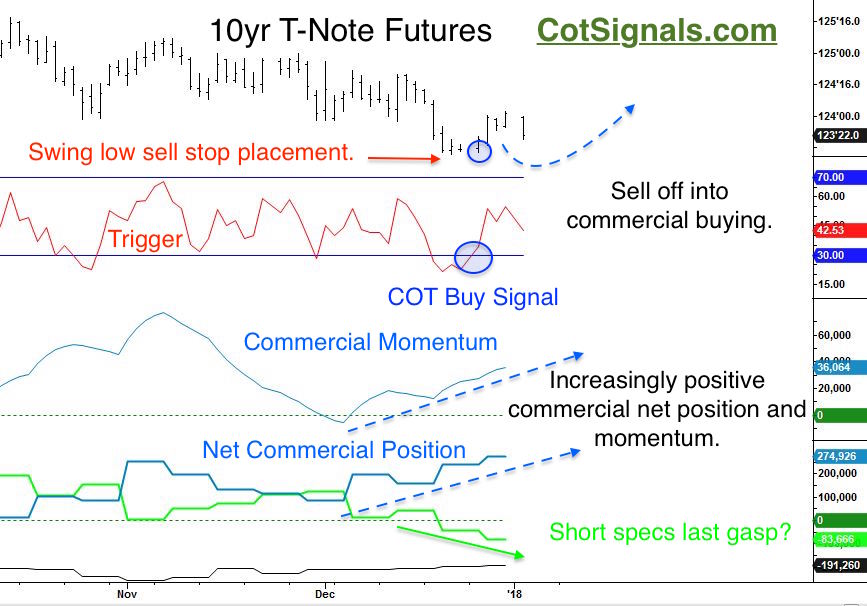
First, let's examine our primary Commitment of Traders(COT) screen. We plot the futures in the top graph, followed by our short-term momentum trigger then, commercial traders' momentum and, finally, the Commitment of Traders plots. Market turns are built through the interaction of the commercial and speculative traders. Typically, the bigger the conflict between these groups, the bigger the turn. The commercial traders are the collectively attached players in the market. Those with an underlying business model tied to the rise and fall of a given commodity's price. The consensus of their actions typically proves correct over a medium length time frame. Let's examine the 10-year Treasury Note setup, below.

The speculators are typically trend followers. This is what leads to their growing position size as markets continue to drift. Their positions are usually weighted more heavily towards recent prices creating a reverse pyramid effect. This is why bubbles bubble. We'll see if Friday's unemployment report provides the catalyst to push the March 10-year T-Note contract above 124^16. This would break the downward sloping weekly trend line and force many trend followers banking on Fed action for the long-term to rethink their positions in the near-term.
 Let's be clear; we are not suggesting lower rates over the long-term. What we've found is that money has been going into equities at the expense of interest rates early in the calendar year as investors make allocations. This action has distorted prices in the short-term and is providing a trading opportunity on the long side of the interest rate market through the end of the month. This is backed up by the commercial traders' actions as published in the COT report and by our seasonal analysis, below.
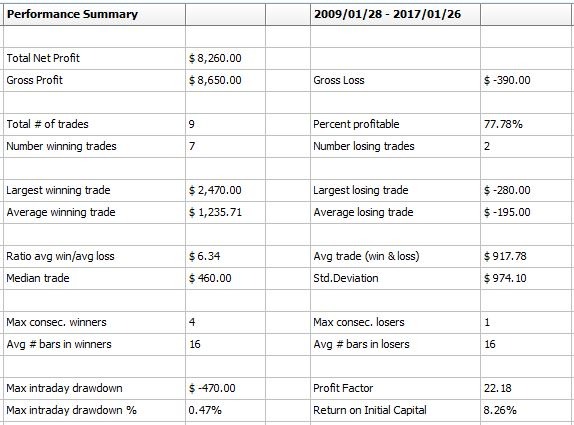
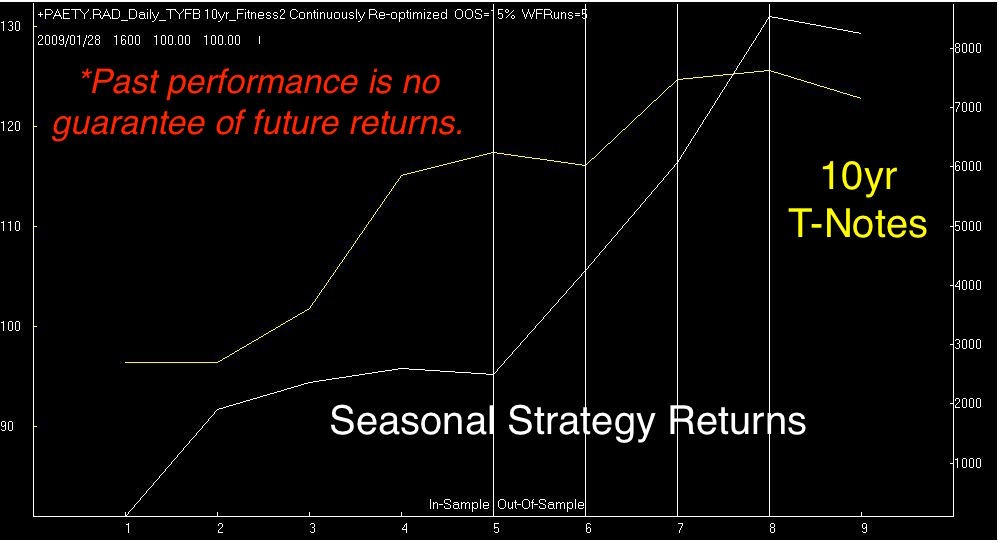
Our seasonal analysis is the newest tool in our box. Thanks to improved computer modeling, education, and networking, we've slowly been unwinding the COT/seasonality conundrum. Commercial traders seem to have an edge on the speculators regarding pending seasonal moves within a given market. The dates and holding times fluctuate based upon the timing and size of the conflict between the commercial and speculative traders but, once the market moves, the commercials are far more frequently the ones on the right side of the market. Combining seasonality and the COT report has led to the development of the following models in the 10-year Treasury Notes.

These statistics are a bit gaudy. I've never traded a mechanical program that can sustain a profit factor of 22.18 like the one posted, above. Most of these trading statistics are irrelevant for the given sample size. However, they are out of sample and do reflect chronological runs on the underlying futures data. I continue to publish them because they are as familiar as the program's equity graphed alongside the respective futures' market's closing prices.

*Past performance is no guarantee of future returns.
The method I use for trade calculation, and risk assessment is Monte Carlo testing. This is nothing new but, the way we calculate it helps ensure strategy robustness over time when there isn't much relevant data with which to work. The test below represents 1,000 runs over various slices of data. All percentages are based on a $100,000 balance for simple calculation.

*However, past performance is no guarantee of future returns.
You can see that these performance statistics are roughly equivalent to those posted, above. However, these are a bit more realistic. One of the most relevant relationships is between the Max Drawdown and the standard deviation of those drawdowns. This provides a much more precise assessment of potential risk. In this case, our average Max Drawdown is $240 or, (.24%). However, the standard deviation of those drawdowns is $2,060. Therefore, roughly one-third of our Max drawdowns should fall within $1,820 - $2,300 range. I've been trading for myself over 20 years, and risk is still the first thing I look at in any setup.
On the positive side, the average return is nearly three times the standard deviation of those returns. This equals a spread of expected returns somewhere between $940 (.94%) and $1,980 (1.98%). Furthermore, the nearly three to one spread between the average return and the standard deviation of those returns helps determine if we're getting lucky with a couple of big trades or, locking on to a predictable slice of data.
If this type of analysis piques your interest, the 30-year Treasury Bond trade is expected to fire later this week, and its performance has been even better.
Discretionary COT Signals Free Trial
Seasonal Analysis - $35 per month.
For details on the silver trade click, here.
Use password - silver


