

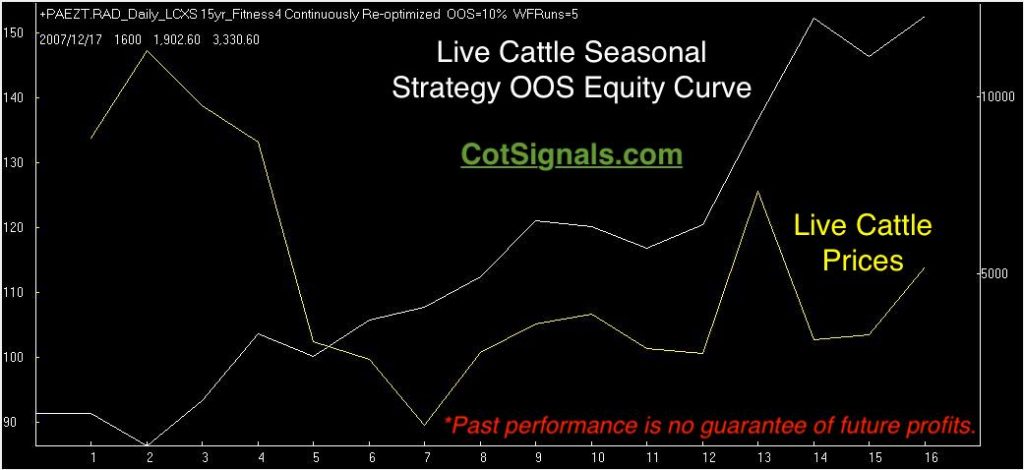
Live cattle futures exhibit a unique seasonal pattern this time of year. The pattern is unique because there are potentially two seasonal trades between Thanksgiving and New Year. Many times, this creates anear reversal pattern, just as we had last year. We made more than $4k per contract on these two trades just last year. Now, the February live cattle futures are set up for the first of these year-end opportunities.
First, we'll take a look at the equity curve from the model we'll be employing this year. IMPORTANTLY, note that last year's trades are NOT the same as the $4k+ we earned last year. That is because the model varies from year to year due to current market conditions. While we may be able to predict periods of strength and weakness a year in advance, we cannot account for current market conditions that far in advance. Therefore, we use a strict testing protocol that produces the out of sample results shown in the graphics. We then use these figures to determine an appropriate trading plan. You can see our real-time seasonal trading results, here.
Here is the out of sample performance summary but, read on for the Monte Carlo results I use to formulate my trading plan.
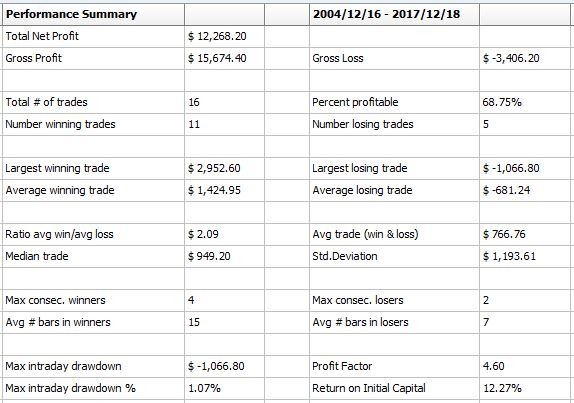
*Past performance is no guarantee of future profits.
We always close with the Monte Carlo results. Monte Carlo testing helps tackle the small sample size issue inherent in seasonal trading. Annual trading events just don't provide much data. Monte Carlo testing mixes up the data 1,000's of times thus, providing better statistical measures.
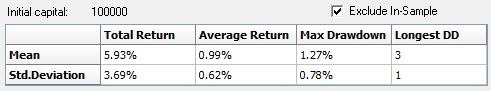
Note that I set the initial capital to $100,000. This is to make percentage calculations easily translatable to the Dollar figures in our net liquidation values. The Monte Carlo testing tells us that we can expect to make almost $1,000 on average with a standard deviation of $620. The spread between the mean and the standard deviation suggests that we have a better than 2/3's of our trades should fall between $620 and $1,620. It also shows that our maximum drawdown has been $1,270.
Now, if you'd like to have these trades emailed to you and updated throughout the time we carry the position, please sign up for just $35 per month.


