
The next trade in our seasonal lineup is a good example of seasonality in the financial markets. This is also a good example of, "Buy the rumor. Sell the fact."
We'll buy the December mini S&P 500 futures, risk 1.5% from our entry point, and hold the position for 15 - 20 business days.
This trade capitalizes on the anticipation of our holiday season. This trade also exits before many of the holiday shopping metrics have been recorded, hence "Buy the rumor. Sell the fact."
Many of you may be suspect of an algorithm that's made money on the long side of the stock market over the last ten years, and I'd agree with you. The stock market rally has distorted existing trends while continuing to defy logic. I'll merely say that we have very few stock index seasonal trades in our portfolio for precisely that reason. Let me walk you through how we separate the stock market's rally from our testing protocols.
The decade-old rally suggests that any two points in time could be plotted in a positive manner. This has allowed buy and hold investors to sleep peacefully. We are not buy and hold investors. We expect to generate large returns within a narrow window of opportunity. I'm a firm believer in time risk. Two investment vehicles providing the same rate of return can be subject to significantly different risk profiles just based on the amount of time spent in the market to generate those profits. One of the first tie-breakers I look at is efficiency. The chart below plots the out of sample returns for our seasonal S&P 500 long position vs. the S&P 500's closing price over the last ten years.
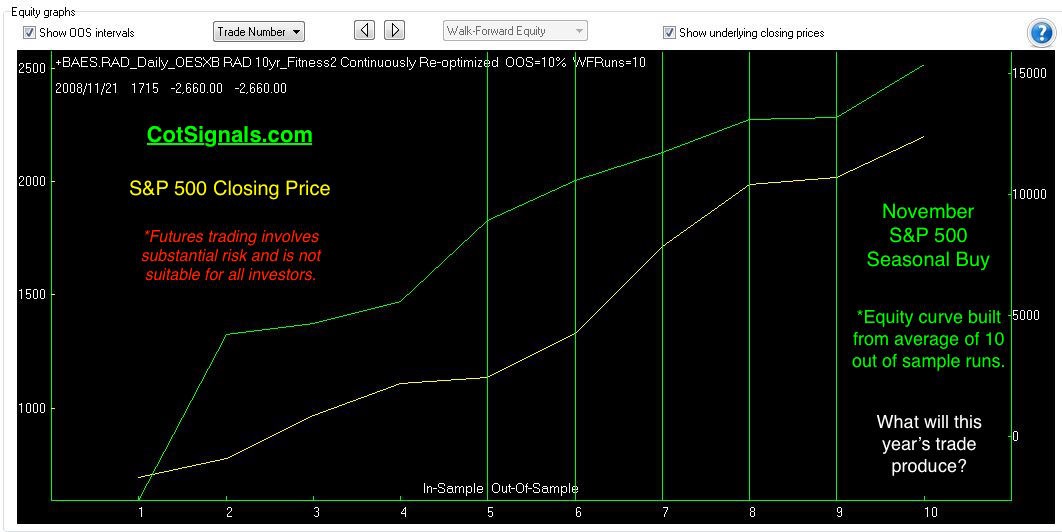
The scale on the left is the S&P 500 closing price. The scale on the right is the accumulated profit generated in the out of sample testing.
Here are some more metrics from our testing:
This model has won 90% of its trades.
The model generated one loss in 2008 for $2,650. That is its biggest and, only loser.
The average win is more than $1,800.
Now, let me walk you through my criteria.
Chronological testing only goes so far - especially in seasonal testing because there is so little relevant data. Therefore, we do a lot of cross-validation using statistical tools that make our program less likely to be curve fit due to the rally's persistence, as well as determining the algorithm's validity as a mathematical concept.
The chart above illustrates the fact that this program more than keeps pace with the underlying market while being in the market less than 16% of the time. Eighty-four percent of the time, our money was safely in cash.
In order to generate these returns, we'll look at the following table:
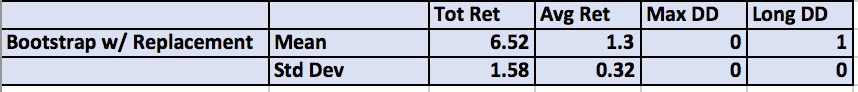
These are the Monte Carlo results calculated from the average of the ten out of sample runs used to generate both the first chart and, more importantly, our next trade. Bootstrap with replacement is a testing method that allows us to create statistically significant results with limited amounts of data. Feel free to call if you'd like more information on the details of the sampling method. The purpose of this table is to show that the average win is significantly larger than the average trade variation. In other words, the average win is more than $1,800, as stated above. The average trade (W-L)/# trades is still more than $1,500. The average spread of approximately $300 suggests that profits are reasonably consistent from year to year. This analysis provides unbiased context for the largest chronological win of more than $6k as the market bounced in late 2008.
Unfortunately, many of these testing methods are executed outside of standard trading applications like Tradestation. Therefore, we'll keep tweaking our presentation until you tell us we're getting the information out to you in a manner that you can digest. Please, keep the feedback coming!
Sign Up for Seasonal Analysis - $35


