A very rare occurrence is taking place in the silver market; silver processors and industrial users are more bullish on prices than the silver bugs. I specialize in reading the Commodity Futures Trading Commission's (CFTC) weekly Commitment of Traders (COT) report. This report breaks down the positions being held by the various market participants. We focus on the battle between the commercial traders and the large speculators. The interaction between these two groups is easily identifiable and works very well for catching meaningful tops and bottoms across the 25 commodity markets I track, nightly.
First, a brief explanation of the report. The COT report is tallied each week. The graphs below show the commercial traders' net position in blue and the large speculators' net position in green. Commercial traders' actions are driven by their business plans. Silver miners hedge their anticipated production by selling futures contracts while silver processors buy futures contracts to ensure a steady supply of raw material. Historically, the net commercial position has been dominated by the producers' hedging of anticipated output. Therefore, the net commercial position has always remained in negative territory. This is one of the reasons we track commercial traders' momentum, rather than the sum of their positions. More importantly, recent processor purchases have threatened to upset this relationship and push us into unknown territory.

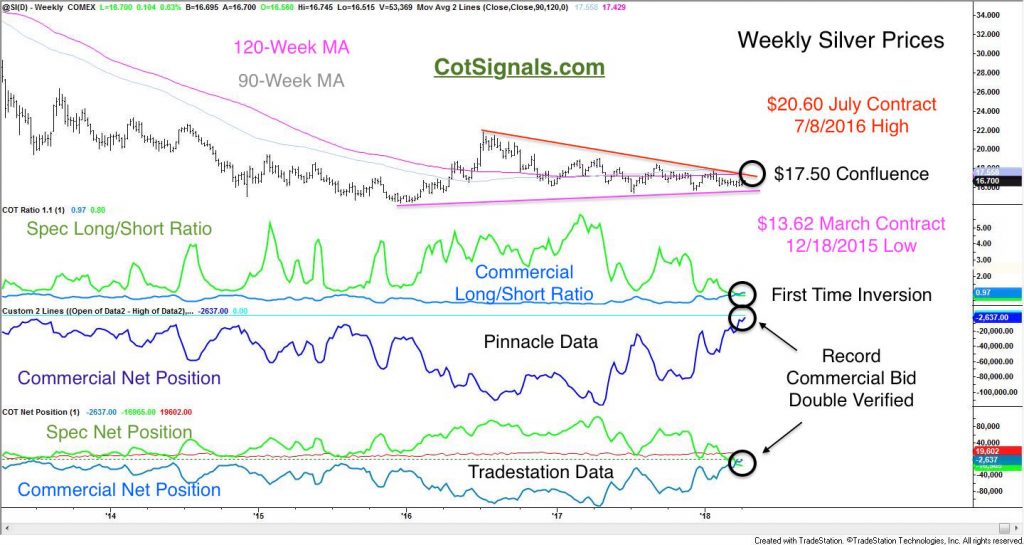
The weekly chart verifies the record commercial bid on both Tradestation and Pinnacle data. I've also confirmed this at the CME Group's site but, their data is not on the chart. The weekly chart shows that the market has been consolidating for more than 18 months. Silver processors have accumulated more than 100k contracts since they began buying last April. Recently, this has caused the commercial portion of the COT report to become more bullish than the speculators for the first time in history. This looks like one more example of the speculators, who've taken an opposing short position, will have on their most significant position at the most inopportune moment. You'll notice that this is a pattern they're prone to repeating on the daily chart, below.

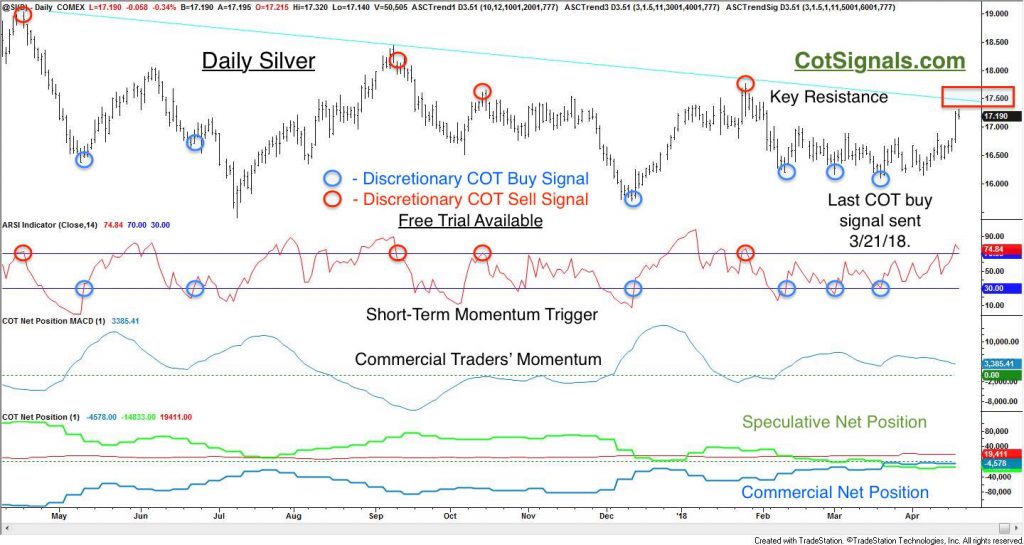
The daily chart shows our discretionary swing trading application. These trades are based on the failures trend following speculators to push the market beyond its consolidation thus, forcing a breakout and a new trend. We track the building of positions between the speculators and commercial traders. Once the speculators push the market into far enough against the commercial position, and into the overbought/oversold territory on our short-term momentum trigger, we prepare for a reversal because the market typically resolves the conflict in favor of the commercial traders. Most importantly, once the reversal is triggered, we place a protective stop loss order at the most recent swing high or, low.
Now, let's look at the trade at hand. We have a clear COT buy signal, but there are also other factors to consider. Silver rallies are typically an inflation play. Interest rates have most likely bottomed but, real inflation isn't really on my radar. I believe a more significant boost will come from a declining dollar. The COT metrics in the Dollar Index are relatively benign but, the individual currency pairs against the Euro, Pound, and Yen paint a grim picture for the Greenback and, they account for 82% of its composition.
The speculators appear to be holding their breath as the market leans on the confluence of resistance around $17.50 per ounce. This area represents resistance from multiple technical sources, including the 90 and 120-week moving averages, the weekly trend dating back to July of '16, and the daily trend dating back to April of last year. However, it has been my experience that bottoms are formed during periods of low volatility while tops are created under extreme volatility. Therefore, as long as the market holds above the recent low at $16.10, I believe the overhead resistance could be penetrated any day. A close above $17.50 should spook the speculative shorts, further fueling the rally. Their run for the hills and a declining Dollar could quickly push the market through $18. Once through, the next nearest resistance is the weekly trendline now near $18.80, which dates back to August of 2013.


