Andy’s Commitment of Traders tools for TradeStation
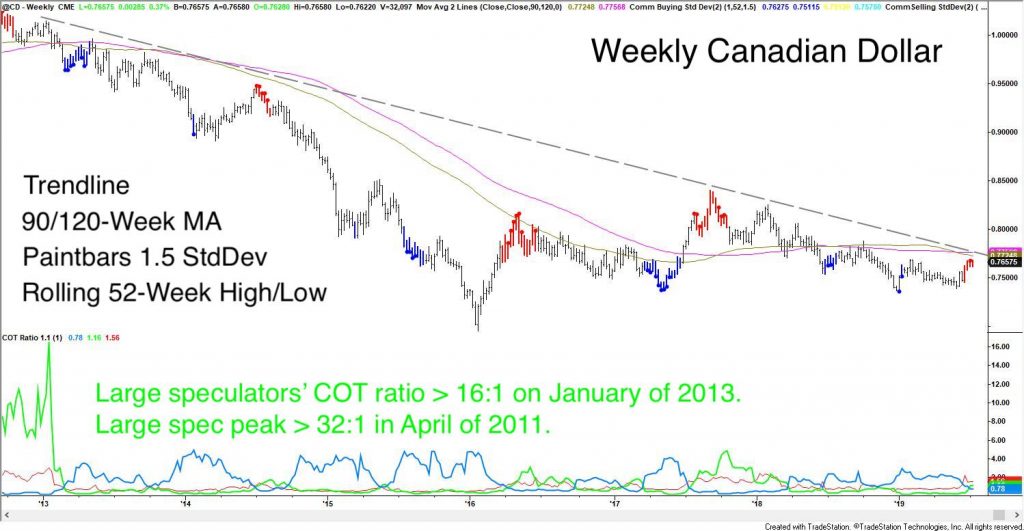
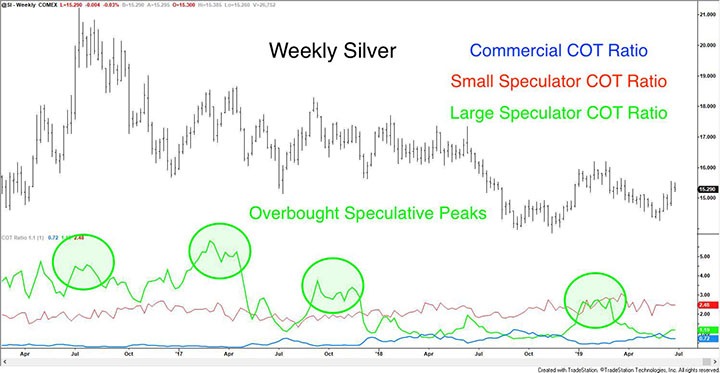
Andy’s COT Ratio – We convert the raw COT data into a ratio of longs/shorts within each participant's trader category. The raw numbers in the weekly report are virtually useless without context. The COT Ratio intuitively displays the market’s concentration of positions among the commercial traders, large speculators and, small speculators.
You’ve seen Andy write about it many times and seen it expressed as, “the large speculators are now long eight contracts for every short…” You’ll see this displayed graphically, below.
1) How imbalanced are the players’ net positions? How long or short, are they?
Positive (net long) values are read exactly as stated.
If the COT Ratio = 2 then, that trader group (Lg Spec, Sm Spec, Commercial) is long 2 contracts for every contract they’re short.
A COT Ratio of 1 is perfectly balanced.
COT Ratio:
2 = 2, 1 = 1, .9 = (1.11), .8 = (1.25), .7 = (1.43), .5 = (2), Etc.
2) Is this a new net position high or low for the last (X) period? Is this a new net high or low over the last year?
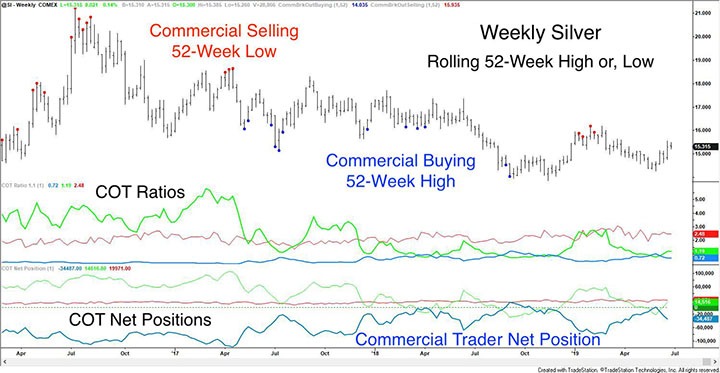
Of course, you can adjust the period of the breakout to any timeframe you’d like. I’d suggest keeping an eye on five-year breakouts, as well. Longer timeframes provide fewer signals but they can identify large scale, macro economic moves.
3) How does their current action compare to their average action? How anxious are they?
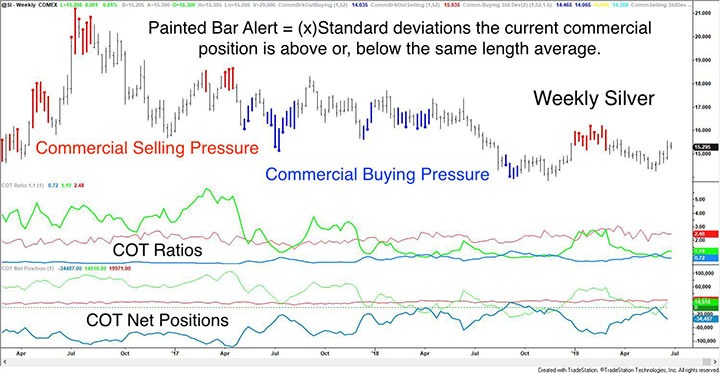
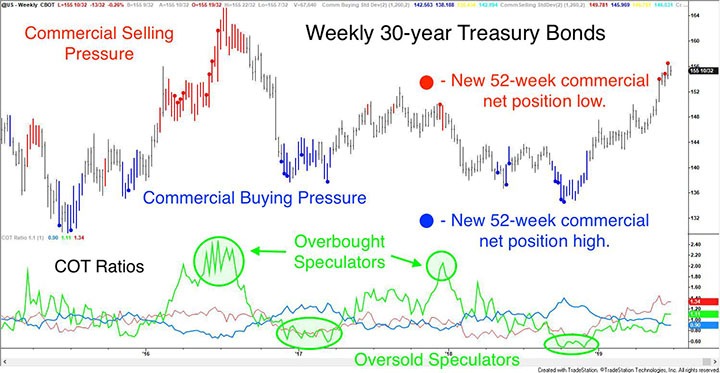
Commercial buying and selling pressure measure how anxious the commercial traders are to get their hedges done at the market’s price. We calculate and track the standard deviation of the net commercial position. We want to know if this week's actions are significantly greater than their average week-to-week activity.
This paint bar study is adjustable by length and the number of standard deviations above or below the length’s average.
Putting it All Together
