Our business focuses on the commodity complex. We rely on the Commodity Futures Trading Commission's (CFTC) Commitment of Traders report to sort out what the major players are doing in the commodity markets. Our focus lies with the commercial trader category of this report. These are the traders who either have the commodity to sell or, will be using the commodity in their manufacturing processes. Following the commercial traders category, as a whole, for a given commodity can provide us with a consensus opinion from the world's largest producers and end users of a commodity. There are times, like now, when their collective actions in the commodity markets can pay direct dividends to equity traders, both in individual stocks as well as commodity based ETF's.
The wild ride commodity prices have had over the last few years can be expected to continue through most of 2016 as the current, record breaking El Nino finally begins to dissipate. So far, El Nino's effects have followed the course of history rather than the hype. We've played on this for nearly a year now and have written extensively on EL Nino's effects on the global commodity markets in the past. The short version for El Nino trading is; buy the rumor, sell the fact. As we've seen, commodity prices have continued to decline in the face of TV's weathermen and women. The depressed nature of general commodity prices and the commercial traders' actions within these markets are the focus of today's investment idea.
Declining commodity prices have two effects. First, it drops the input cost of finished products. Secondly, it pressures commodity producers' pricing power. Today, we'll look at the consumption side of this equation as these companies and those like them will be the primary beneficiaries.
Beginning in 2007, commodity prices began to rally. This put a major squeeze on companies like Frito Lay and Tropicana, divisions of Pepsi (PEP) as well as Kellogg (K) and Kraft, which is owned by Mondelez (MDLZ). Further impacted were meat producers like JBS and Tyson (TSN). Companies whose key inputs were tied to commodity prices had two options. They could raise prices or, decrease the packaging volume. Many who chose to raise prices were taken to task for price gouging while those who shrunk their packaging sizes were able to sneakily pass some of the cost increase onto unaware consumers. Many of these same companies then faced the same issue during the commodity rally of 2012. The important point for investing is that as far as I've been able to tell, packaging volumes have remained at their smaller sizes even as the commodity markets and therefore, input costs, have declined by more than 50%.
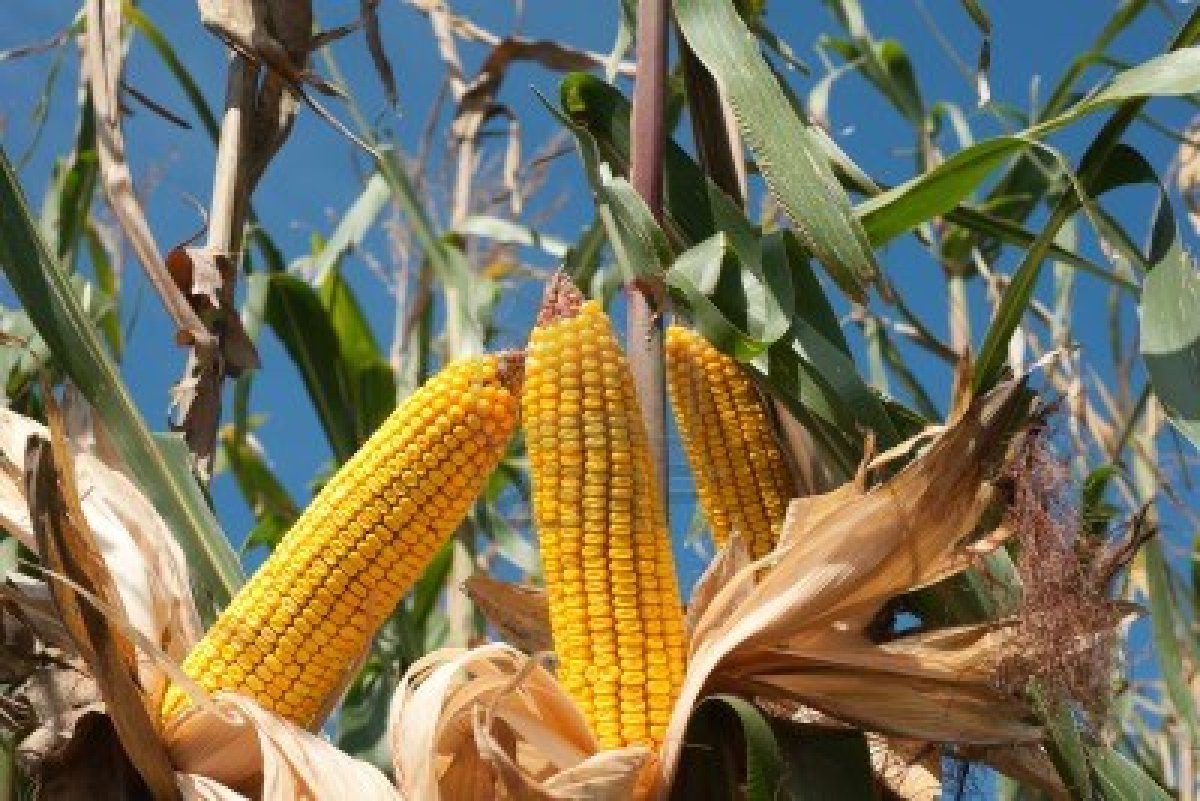
 This brings us to the current situation. Tracking the commercial traders' behavior allows us to see the action of their companies' research departments and who doesn't want access to the actions of Fortune 500 companies' proprietary research? Looking at the chart below you'll see the price of corn in the main graph and the net commercial trader position in the lower graph. We refer to commercial traders as, "value traders." Their models are based on the ability to contribute to the companies' bottom line. As such, they tend to be negative feedback traders; buying more as prices continue to fall and selling more as prices rise beginning with their primary assumption of fair value. Commercial traders as a whole appear to believe that corn priced under $4 per bushel will, in fact, have a material impact on their bottom lines. This was true this summer when General Mills (GIS) reported the following: "Our Convenience Stores and Foodservice segment recorded good sales growth, increased its operating profit margin, and delivered record profit results."
You can see that we are nearing the critical floor of $3.50 per bushel in the corn market. Considering the market’s current price relative to historical context, it behooves us to take a close look at the tremendous commercial buying we've seen on this market's decline. Commercial traders have purchased more than 300,000 contracts at 5,000 bushels per contract under $4 per bushel. That's a dollar cost average of nearly $6 Billion Dollars on 1.5 billion bushels of corn. This chart shows the impact and scale of global food production as multi-nationals load up on cheap input prices.

Given the stock market's already precipitous decline this year, we have our doubts about this being another record setting year. That being said, a 10% January correction is hard to ignore. Therefore, as an attempt to safely wade into the declining market, we believe companies with major food processing operations or ETF's like CORN, have two major advantages against the broader market. First, they have a direct pricing advantage due to lower input costs relative to final market value as many of them are still charging the same prices or continuing with the smaller packaging. Secondly, if the broad market sees further declines, the defensive nature of food stocks and general demand for boxed food production should remain solid if not, increase as consumers spend less and eat at home more often.


