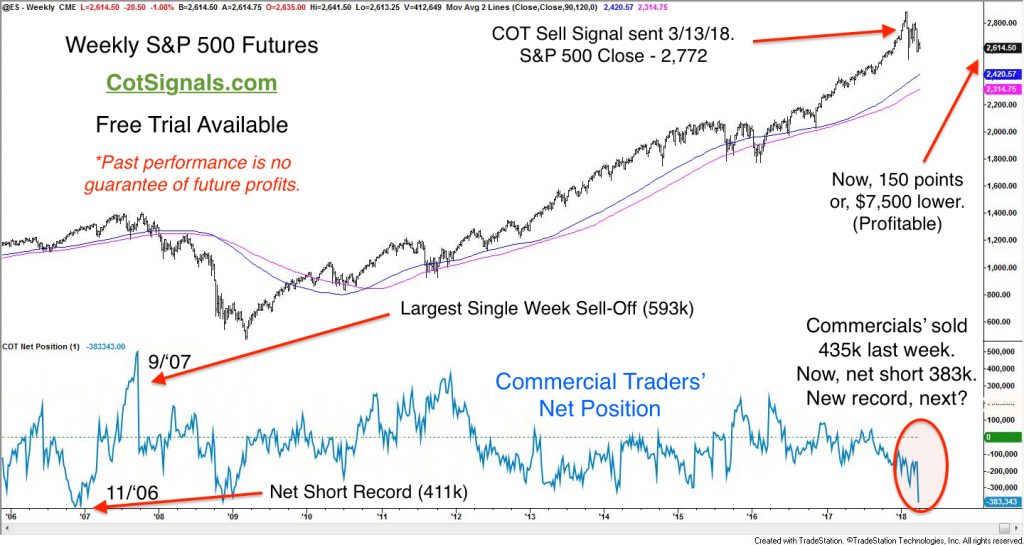
There's been a lot of talk about trade wars triggering an overdue stock market correction. We all pick up our signals from different places. I watch the Commitment of Traders report, and commercial traders sold more mini-S&P 500 futures contracts last week than any week since September of 2007. This has brought the commercial traders' net position to its most bearish level since November of 2006. I'll show you why this matters and how we were able to signal a profitable trading opportunity to our clients.
The Commitment of Traders report breaks the market's players into a few primary categories; commercial, large speculator, small speculators and, index funds. The commercial traders are the largest players. They use stock index futures to adjust their overall exposure to the index they're trading. Stock index futures are valuable hedging instruments because they provide single-click, broad market exposure and, are highly leveraged. The leverage makes them capitally efficient. The table below explains the capital efficiency along with the relative size of the given instruments.

Stock index futures provide approximately 20:1 leverage. This allows portfolios to be hedged while tying up minimal investment cash. Putting this in perspective, the commercial traders sold 383,000 contracts last week. That's the equivalent of more than $50 BILLION in market capitalization. Of course, part of this is because the S&P is the biggest game in town. Its market capitalization is more than ten times each of the others. Portfolio managers need to be able to count on volume providing enough market liquidity for them to move in and out en masse. The open interest in the mini-S&P 500 is approximately six times the smaller sized Russell 2000 futures contract.
Moving to the next chart, you'll see the weekly S&P 500 plotted back to 2006. It's been quite awhile since the economic crash and the shift towards QE and legislated stock market support (i.e., banning short-selling). We did the calculations, and its been 549 weeks since the commercial trader sold this many contracts this quickly.

Our trading philosophy is based on following the commercial traders' lead. It's important to remember that the speculators are typically wrong at the market's most climactic moments. Speculators take the other side of the commercial trade in anticipation of trending markets. Not only is it looking like the stock market may no longer be trending higher but, the swift and substantial actions by the commercial traders suggest the end of the party could be here, shortly.
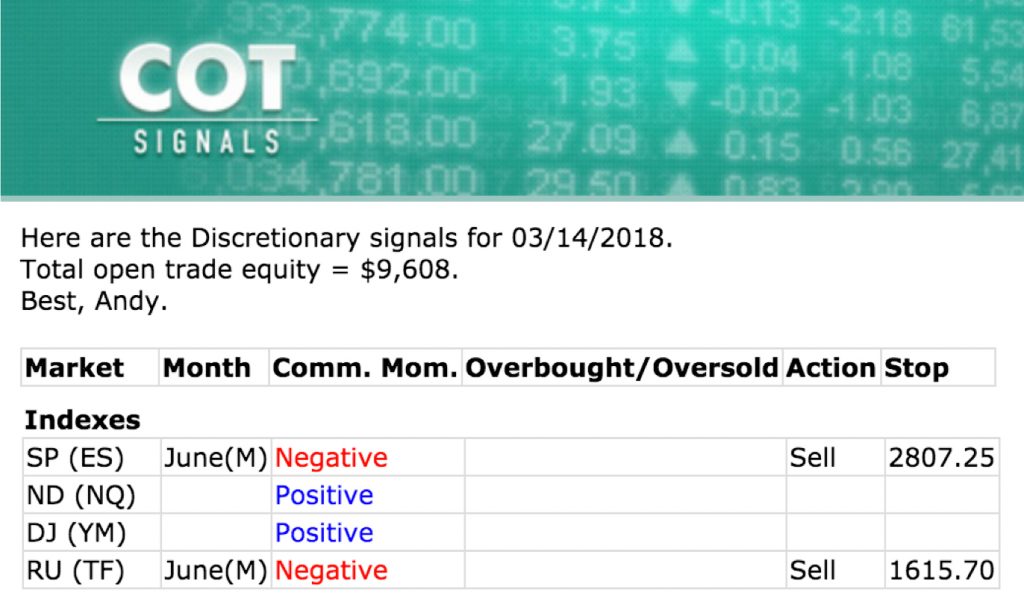
The speculators have been trying to push the stock market higher and, higher. Clamoring for, "More!" Their buying pushed the market into overbought territory on March 13th, against the backdrop of an increasingly bearish commercial trader population. The conflict between the commercial and speculative traders occurring at overbought levels set the trigger for a Discretionary COT Sell signal, which fired for trading on the open of March 14th.

I've been keeping this worksheet for years. It puts me on the lookout for markets primed for reversals. Along with providing the entry signal, I use the recent swing high or, low for the protective stop. The reversal is generated by the algorithm but, the protective stops are pattern-based.
Discretionary COT Signals Free Trial
The commercial traders' actions in the mini-S&P 500 futures have all my bells and whistles sounding. It's always hard to call a turn in a multi-year trend but, the people who make the market direction decisions for the most prominent banks and trading firms all thought last week was a good time to sell more than $50,000,000,000 worth of stock index futures.
Short-term patterns suggest an early downside target near 2,430, meanwhile the 90 and 120 -week moving averages come in at 2,420 and 2,314, respectively. We'll watch carefully to see if this decline provides them with room to cover or if they're expecting further declines. If so, commercial traders will most likely set a new net short record next week.


