

Seasonality is obviously a big factor in the grain markets. This trade points towards a rise in March soybean futures and the ETF, SOYB.
Strategy Stability
I analyze seasonal data in many ways and one of the factors I use to determine the potential stability of a given trade is walk-forward cluster analysis. Now, you don't need to know the details behind the calculations as much as you just need to understand the Tradestation output. As you'll see below, the cluster analysis output generates an expected profit in every one of its possible outcomes for the time period and strategy..
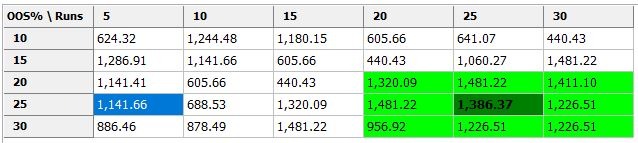
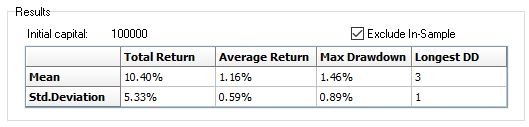
Profitability across all potential combinations is just one of the tests I use in determining which trades to take. Another important but, nerdy, test I use is Monte Carlo analysis. Monte Carlo analysis helps to expand the data set. I use it to help identify risk vs reward. Ideally, I'm looking for an average return at least twice as large as the standard deviation of prices over the forecasting window. In this way, we help to determine statistical validity from random noise. Monte Carlo analysis also helps determine historical risk, which we transform and match to current market prices and volatility.
Dollars and Cents
I always run historical tests of the given model deployed. However, it must be taken with a grain of salt because it visualizes only one string of data on the model we're trading compared to the 1,000 tests run via walk-forward optimization. Finally, the vertical lines in the chart represent optimization intervals. Therefore, everything shown to the right of the first vertical line, starting with trade number 7, is out of sample.
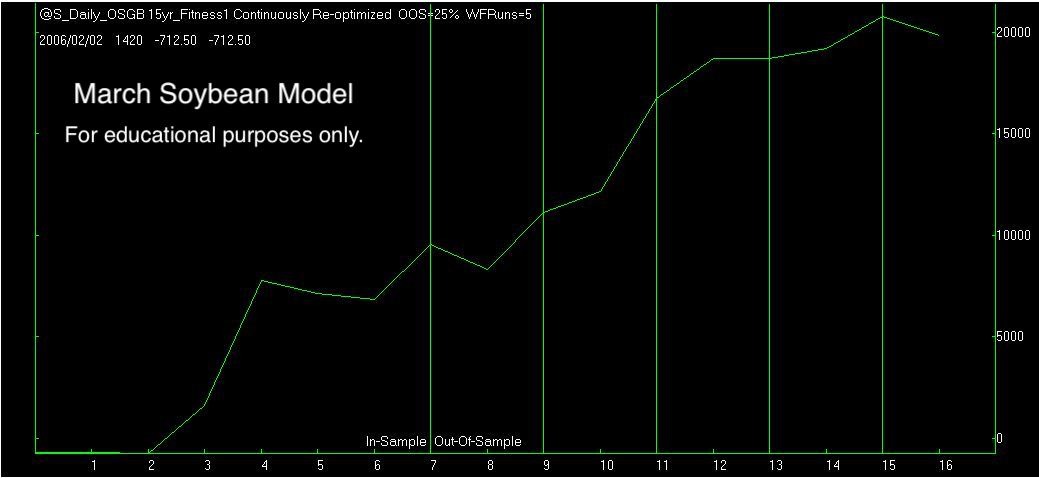
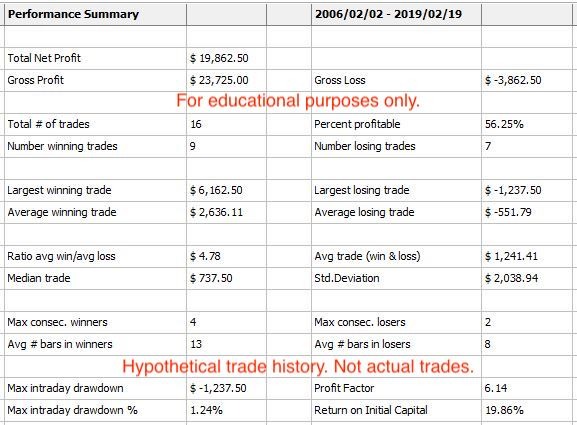
Prior to viewing the historical performance report below, understand that like the performance graph above, this is only one timeline representing a single model. Our testing procedures are far more rigorous and algorithmic trading should only be confirmed by a statistically valid sample size, like our walk-forward optimizer and MatLab seasonal analysis.
Putting it all Together
We'll buy March soybeans or SOYB at the end of January. We expect March soybeans to rally into Valentine's Day. However, if we're wrong, we'll get out around $14.78 per bushel and take our loss. This would be a loss of approximately $1,350 in the March soybean futures contract or, approximately 1.8% of the face value allocated towards an ETF trade in SOYB.
On the profit side, I expect March soybeans to climb through the recent congestion in the coming weeks and fight their way towards $15.75 for gains of $3,500 in the futures contract or a gain of approximately 5% in the ETF in less than one month's time.


