
Our next seasonal trade looks like it will kick off tonight, in the Japanese Yen. This is a quick hit trade, barely lasting more than two weeks.
First, let's look at the chunk of the Japanese Yen's 15-year seasonal pattern that we'll be slicing out.
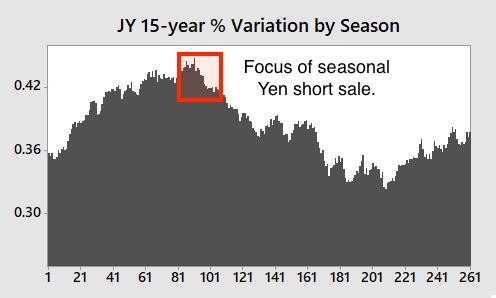
The Japanese Yen rallied by a little more than one percent last week. We don't believe that something has suddenly healed the Yen, implying that this is the bottom. Quite the contrary, we're thankful for the bit of upside volatility as it provides us with a potentially more optimal short entry point. While discussing percentages, we'll be risking two percent from the entry price. This is a little over 180 points based on the June Japanese Yen's current price of .9150. One-hundred and eighty points in the Japanese Yen equals $2,250, and initial margin at our clearing firm is $1,980 per contract.
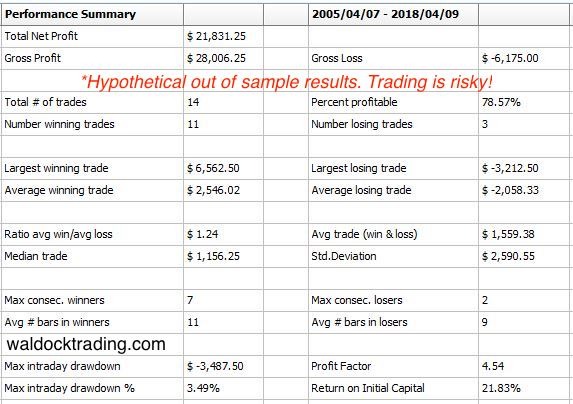
The model we're using is providing out of sample performance statistics beginning with the second trade. This provides a nice, statistical picture of what we're expecting.

This model has performed well out of sample with a maximum of two losing trades in a row. Analyzing the market history during the losing periods reveals a spike that knocked us out two years ago before the Yen resumed its downward trend and the US Dollar move following the 2016 election. All and all, this pattern has been fairly repeatable as I believe it to be correlated with US tax returns along with other trades related to the same massive money moving annual phenomena.
Finally, I follow the Monte Carlo results more so than the performance results. Even with the lengthy history of the currency markets, analyzing annual events doesn't leave us with much data...especially as the world changes. Therefore, I like to see an even more well-rounded version of what to expect. The Monte Carlo analysis is based on a hypothetical 1,000 trades, rather than the 14 listed, above.
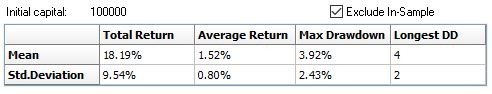
As you can see, the expected average return is nearly double the standard deviation of the average returns. I like to keep this metric at 2:1 or, better. That means that the average wins are substantial and the model's success is less likely to come from one or, two big trades.
We'll be selling short the June Japanese Yen this evening. Stay tuned for further instructions.