I specialize in reading the tea leaves of the weekly Commodity Futures Trading Commission's (CFTC) Commitment of Traders (COT) report. This report has been around longer than I've been trading (25+yrs). I use the information provided in the COT report in three different ways; discretionary, mechanically, and seasonally. All three of our models take into account the relative behavior between the commercial and speculative traders. And right now, they all point towards lower Kansas City Wheat prices.
The COT report breaks down the actions of the most prominent players in the commodity markets. Want to know what grain prices are doing? Look at the actions of Cargill, ADM, Bunge, and others. These are the companies with top-level analysis, the deepest pockets, and networks that place them in critical positions to know the inner workings of the markets from which they derive their Fortune 500 profits. In fact, Terrell Crews of ADM's board of directors is also on the board of directors for both Hormel and, Monsanto. Jeffrey Ettinger of Cargill is also a member of Hormel's board. Richard Lenny of ConAgra shares board duties with Jeanne Jackson, who, in turn also sits on boards at McDonald's and Kraft. This is a very small, institutionally enmeshed group of people. These people simply have better information on macro situations than do we. This has been proven in the battles won by the commercial traders over and over again at the markets' most critical junctures.
First, we'll begin with the Discretionary COT Signals. This is a short-term swing trading methodology that I've been using for many years. My nightly worksheet tracks the commercial momentum relative to the short-term price movements that create a market's swings. It is based on the notion speculators seek trending markets but, most markets are in trend mode less than 20% of the time. This is part of the reason that speculators are rarely successful in the commodity markets. They tend to buy the highs in anticipation of the next rally or, sell the lows looking for the subsequent decline. Meanwhile, the commercial traders, as a collective group, seek value. Therefore, commodity processors are buyers at low prices as they lock in future inputs for their business model. Conversely, commodity producers take advantage of market rallies to sell their anticipated forward production.
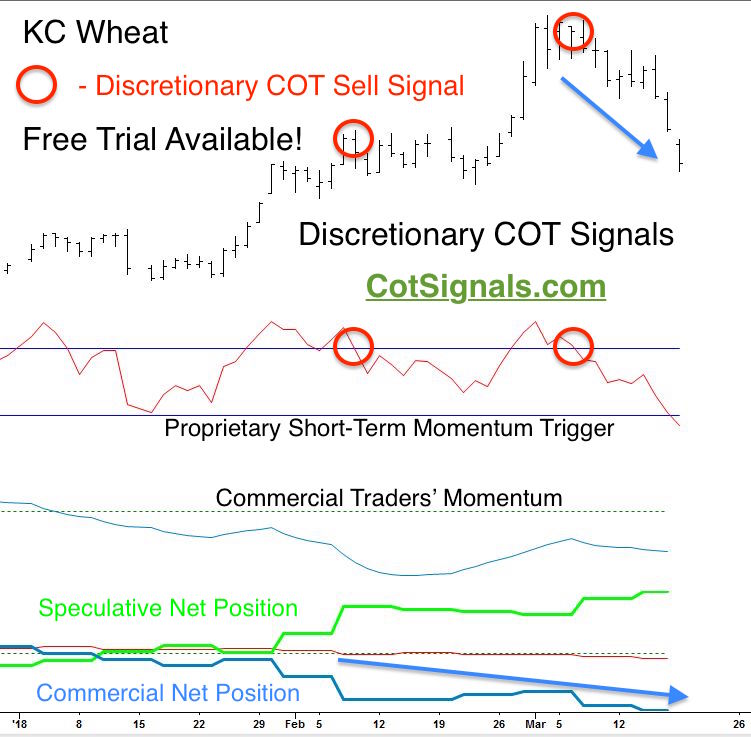
Let's look at the chart, below. The divergent behavior in the net positions between the commercial and speculative traders beginning in February led us to believe that the Kansas City wheat rally would be short-lived. The red circles represent actionable trading signals published in our nightly email. We use the swing high/low as the protective stop point with these trades. It shows we were stopped out in early February before providing the current short signal issued March 8th.

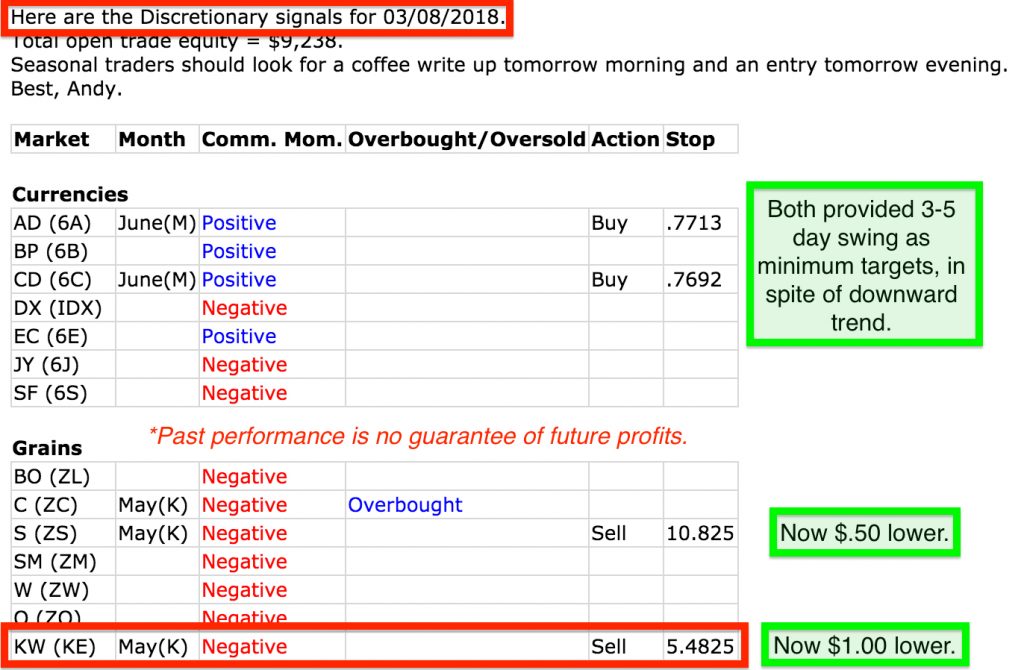
Here's a slice of the nightly Discretionary COT worksheet. I've been keeping this sheet for years and it puts me on the lookout for markets that are about to reverse. I view it as a, "One, two, three" process. One, track commercial trader momentum. The first column states if the commercial traders' momentum is positive or, negative for any given market. Two, wait for the conflict to build between the commercial and speculative traders. I measure this by the overbought/oversold column. This sets the short-term momentum trigger. Mine is proprietary, but an RSI or, stochastic could be used from a standard charting package. Three, the trading signal is fired upon the market's reversal and a cross of the short-term momentum indicator. Finally, we place our protective stop at the respective swing high or, low.

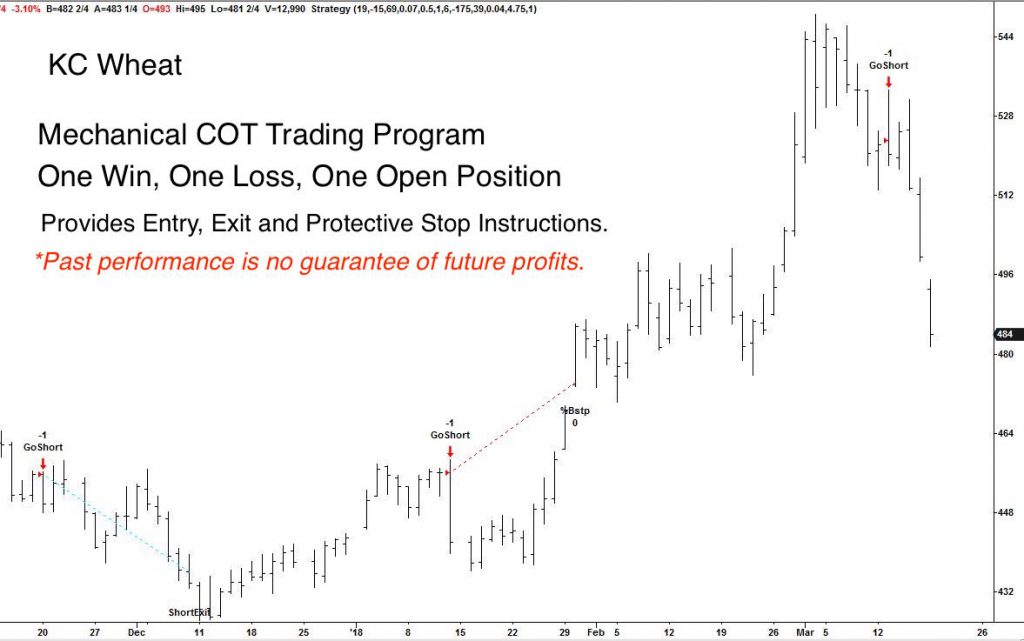
We also use the COT report to generate mechanical trading signals. The development of the Mechanical COT program has been a natural evolution over the last several years. We trade this algorithm across most domestically traded commodities. We've also developed a portfolio building tool on our site that allows for the calculation of multiple contracts to even out trade sizes among the different markets. The trades below are the last three Kansas City Wheat trades. As with most programs, the goal is overall profitability. The first two trades roughly offset each other. We would like to see the current trade yield something like the current open position profit of more than $5k. The most important aspect of our portfolio builder is that it allows the user to see a portfolio's potential risk with their own eyes.

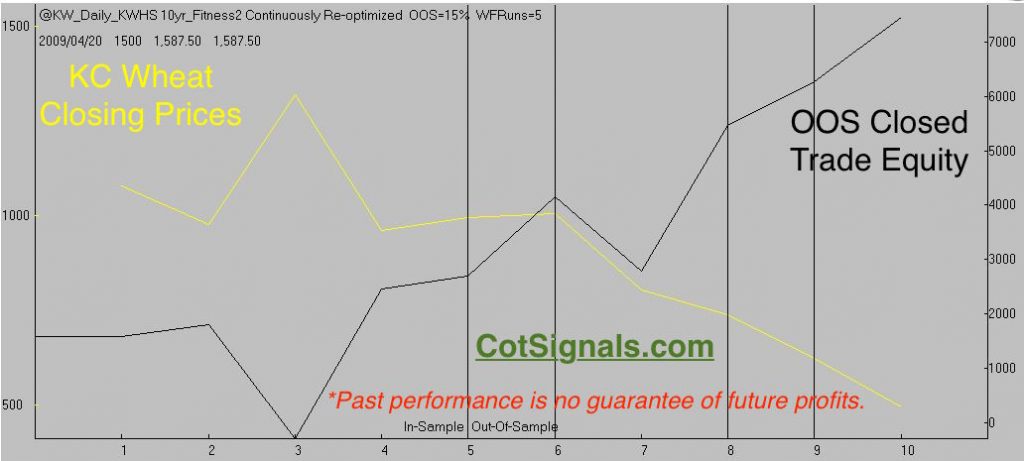
Most recently we've been employing hybrid seasonal/commercial trader models. This model is the last to join the current short Kansas City Wheat positions. This model has been successful in 80% of its out of sample forecasts and suggested that this market could fall another $.30. This seems entirely conceivable based on recent volatility. Below is the composite out of sample equity curve for this model's forecasts.

*Past performance is no guarantee of future profits.
The Commitment of Traders report provides a look behind the Wizard's curtains to see who holds what position in the commodity markets. This is a mean reversion strategy based on the relative value of a commodity as determined by the biggest players in that market. We ride the commercial's coattails and front-run them when we are able. Either way, we want to put the power of their buying and selling on our side. We do it three different ways. The Discretionary COT Signals are the most sensitive and have the shortest holding time of our methods. The Mechanical program quantifies the thesis that, "commercial traders are typically on the right side of a market's major turns." Finally, we've combined our COT analysis along with more in-depth analysis to produce a seasonal trading algorithm. This is our newest product and doesn't have a separate page, yet. However, we're about 20 trades in so, we've posted the seasonal results, here.


