Most of our research focuses on the Commodity Futures Trading Commissions' (CFTC) Commitment of Trades (COT) report. We believe that the commercial traders are more intimately familiar with a market's fundamentals that provide their livelihood than are the speculators who tend to come and go from one hot market to the next. We'll explain how the commercial traders are connected, show you their actions in the soybean futures market, and explain how we employ their efforts to trade the markets three different ways.
First, the commercial traders in the soybean market are companies like Archers Daniels Midland(ADM), PotAsh(POT), Cargill, John Deere (DE), etc. Companies like these have an interconnected web of board members. Consider that Terrell Crews sits on the board of directors at ADM, Monsanto and, Hormel. Gregory Page of John Deere's board is also on Cargill's board with Jeff Ettinger who is on Hormel's board which is also shared with the previously mentioned Terrell Crews, as well as Consuelo Madere of PotAsh. I'm not proposing collusion or malfeasance in any way. I'm merely pointing out the interconnections of the people making the decisions at the highest levels. The board of directors information is available for all public companies. It just takes a lot of digging and cross-referencing. We could go on. Janice Fields, of Monsanto, also sits on the board at McDonald's with Richard Lenny of ConAgra(CAG) and with Jeanne Jackson of Kraft-Heinz.
Our research has shown that the commercial traders tend to be right about market direction more often and in a more predictable way than the speculators. These companies, and others like them, have increased their net position by more than 125k contracts at prices between $9.45 and $9.80 per bushel in the last five weeks and added more than 165k contracts in total during the previous six weeks. We'll look at weekly and daily data along with seasonal, discretionary and, mechanical trading strategies that have all picked up on the recent burst of processor purchases in the soybean market.
 Working from macro to micro, let's begin with the weekly soybean chart. We have two setups on this chart. We've developed seasonal analysis based on time of year and commercial trader behavior. This study forecasts buying the March soybean futures contract probably sometime next week. It's a multi-step process. We're nearing the window of opportunity while waiting for the market action to dictate the actual entry signal, which we'll publish to our subscribers, accordingly. The red arrows indicate the exit bar for this trade over the last few years with the profit or, loss labeled, accordingly.
Secondly, you'll see the setups for our Discretionary COT Signals on a weekly scale. We've plotted the net position of the commercial and speculative categories of the COT data in the bottom pane. This shows how their actions play out over the longer term. Notice the way the commercial traders begin buying or, selling before a market's top or, bottom. This is similar to the current situation as commercial traders added the first 40k contracts six weeks ago when the market engaged its recent decline. Furthermore, notice that they have their largest positions on at the market's most important turns. The commercial traders were sellers at the 2014 high and buyers at the July of 2014 low. Also, notice that they nearly set a new record short position selling the summer of 2016's rally. This shows that the commercial traders in the soybean market are equally split between the producer and processor sides of the industrial equation.

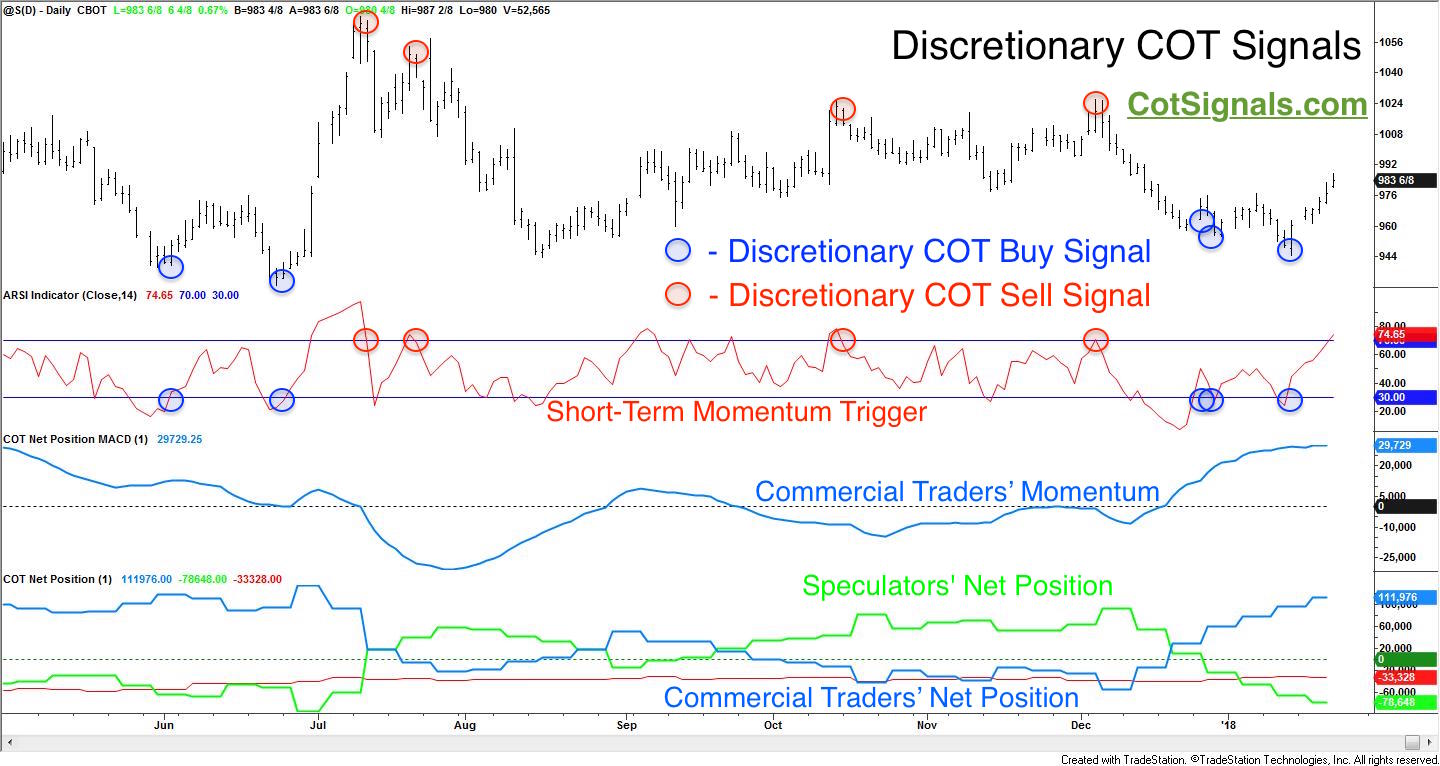
Moving to the daily chart and our Discretionary COT Signal nightly email setup you'll notice the same layering of data and analysis. The Discretionary COT Signals are our most sensitive trading methodology. Part of the reason for this is that I've been sitting in front of trading screens for 25 years and I need something that alerts me to tradable situations in a repeatable manner. The Discretionary Signals are a purely mean reversion, swing trading methodology. The fight between the commercial and speculative traders takes place at what become the swing highs and lows of a market's movement. Speculators tend to be trend traders while Commercial traders are range traders (mean reversion). What the commercial traders see as the top or bottom of their actionable range tends to be precisely where the speculators are expecting the market to breakout and develop a new trend. This reversal strategy is the equivalent of betting the "don't" on a craps table. The commercial traders rebuff the speculative attacks more often than not and send the speculators back to lick their wounds. "Seven out. Pay the dont's"


There are a couple of key points on this chart. First of all, this methodology uses pattern-based protective stop loss orders. Part of trading for 25 years is learning to control risk. I always trade with a protective stop loss order working in the market. The stop losses are always calculated at the recent swing high or, swing low. Here is the buy signal from the worksheet that went out for trading on January 16th. Please note that I still calculate this sheet nightly by hand, hence the typographical error in the contract month for the soybean trade.
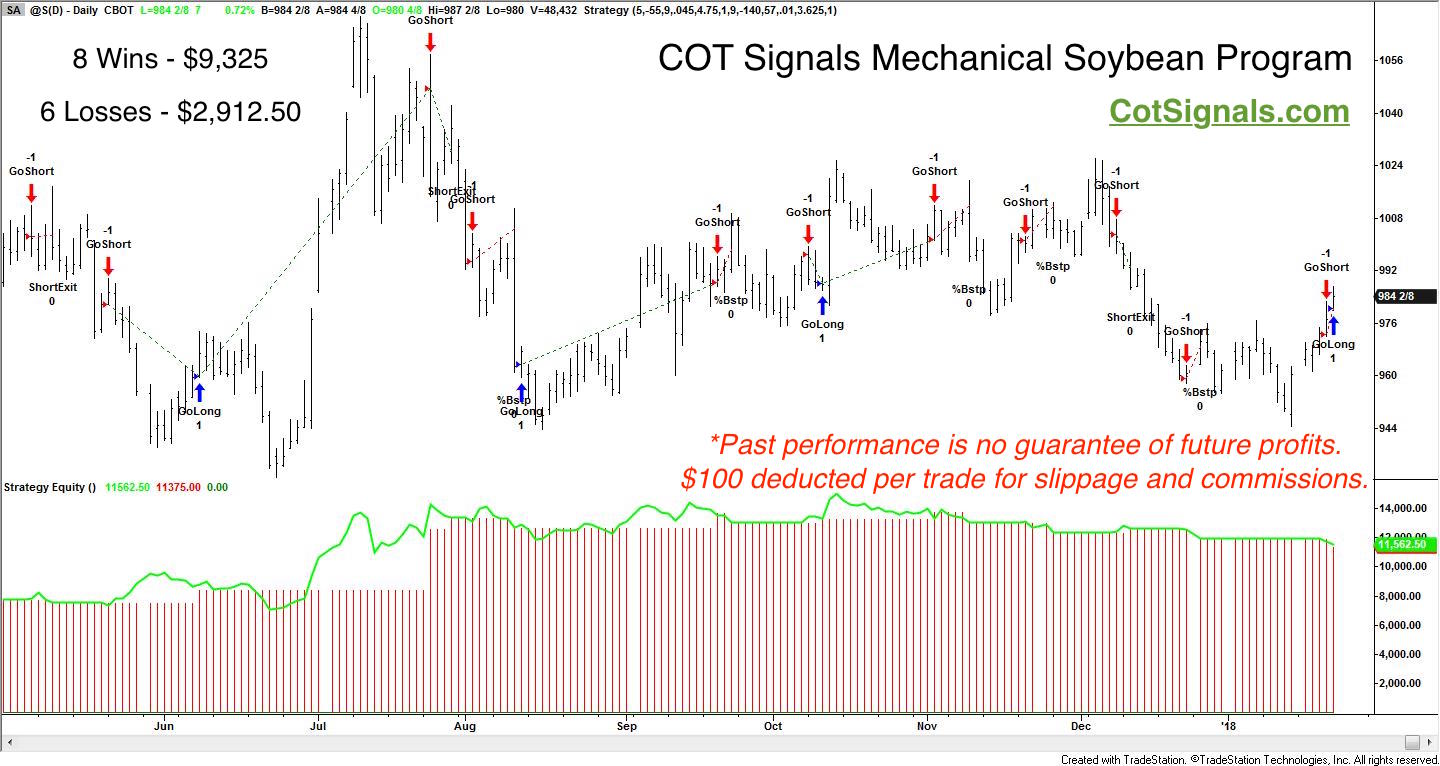
Finally, let's move into the purely mechanical soybean futures trading program we've developed based on the COT report. When you look at the chart below, notice that the protective stop loss orders are no longer placed at the swing highs or, lows. We need to give the market a bit more room on the mechanical side. Therefore, we calculate our stop loss orders as a percentage of the market's opening price once the signal is triggered. The argument between static and dynamic stop loss orders has raged since trading began. Static orders allow us to know precisely our pre-trade risk will be. Furthermore, our percentage based stop loss orders are based on extensive statistical analysis to determine when we're throwing good money after bad and should pull the plug and take our loss.
Dynamic stops, on the other hand, do allow us to vary the stop in accordance with current market action. However doing so, requires trading with a blind eye towards ultimate risk. We don't know how volatile the market could become once we've initiated a position and may find that intra-trade risk, and corresponding stop loss adjustment exceeds our risk threshold.

*Past profits are no guarantee of future results.
You can see that the June long position absorbed some heat as the market continued to make new lows for more than a week, before turning higher, in line with the commercial traders' bid through July. Also, the recent spurt in commercial buying reversed the mechanical position from short to long. All three of our forecasting models, seasonal, discretionary and, mechanical are flashing bullish signals as the commercial processors continue to ensure the raw materials necessary to meet their contracted obligations. We'll side with the directors of the most prominent companies and continue to take our cues from them.
Please visit COT Signals for more information.


