December has been a solid success as our first full month trading our new seasonal analysis. Now, as quickly as the February live cattle futures have fallen, we expect them to bounce. Yes, this seasonal trade is exactly the opposite of the live cattle trade we sold short for a $3,000 profit earlier this week.
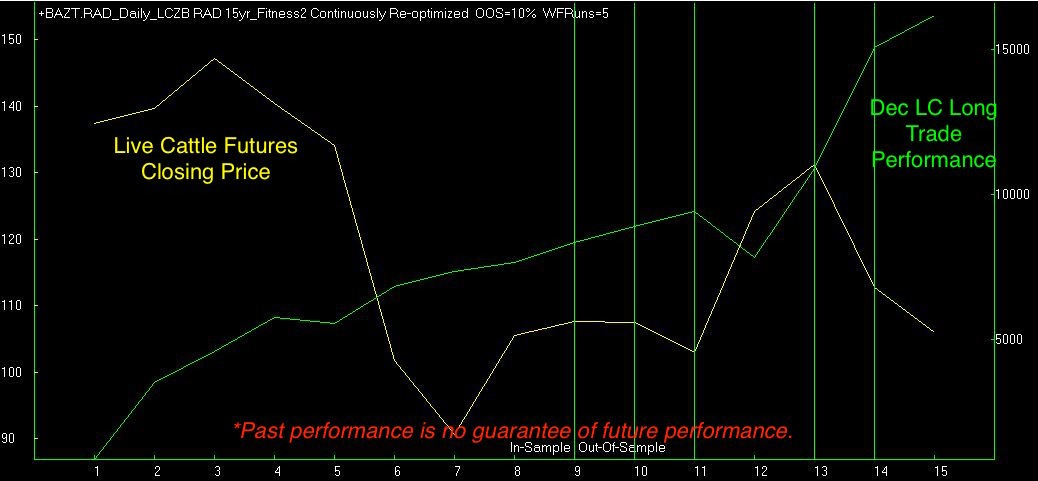
I understand if you're skeptical about turning around and buying a market that we just made so much money on by selling short. The two charts below show the out of sample equity curves for both the short live cattle trade we just took profits on, as well as the long live cattle trade we expect to initiate plotted against the closing prices of the live cattle futures. There isn't much correlation between market movement and the program's profitability. This is due to the algorithm's forecasting ability.

The out of sample trades begin with trade number seven. Cattle prices traded from 90 to 125 and back to 105 over the following eight years. There were two losers, recently. This was more than made up for by this year's profits.

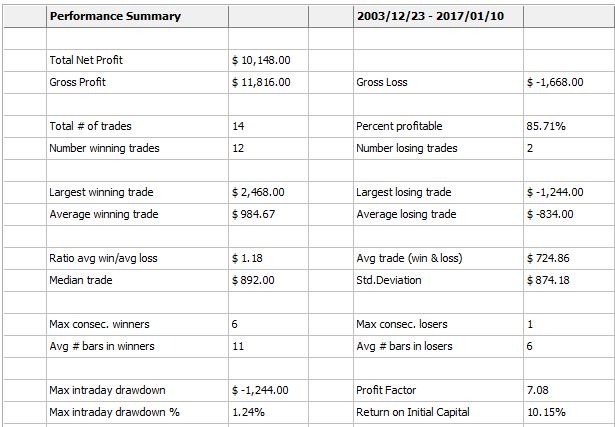
This time, the out of sample trades begin with the ninth trade. Note specifically, though that trades thirteen and fourteen were both profitable on the long side even though the live cattle futures were on the decline. The performance figures from our testing, which include $100 commissions and slippage can be seen, below.

Remember, past performance is no guarantee of future profits.
I mentioned that I trade two cattle contracts for every single contract of S&P's or, copper. There are other contracts and multiples that I trade, but this gives you an idea, anyway. The object is to even out the expected trade sizes across markets so that each trading opportunity represents an equal portion of the profits/losses. This ensures robustness of the method rather than arbitrarily hitting good trades in big dollar markets.
Now, let's look at the Monte Carlo results.

Historical testing only tells us what would've happened for a single string of outcomes. This makes testing seasonal setups more difficult to validate because of the general lack of data. The bootstrap with replacement testing procedure helps ensure that our results are not the effect of catching a single profitable string. Instead, they provide us with a range of percentages that are statistically significant across a range of outcomes. This provides a more accurate depiction of the risks and rewards associated the strategy.
Current subscribers to our seasonal analysis should Sign In for the full details. If you'd like to begin receiving our seasonal analysis for $35 per month, Sign Up!


