Not all data points are created equally. There are times when the numbers alone don't tell the whole story. The new record positions in the Russell 2000 futures are an excellent example of this type of situation. Let's see why "This time it's different."
The Russell 2000 futures have been a favorite day trading vehicle for more than a decade. This is due to the three things a market must possess to be considered for day trading - volume, large tick size, and volatility. Volume is necessary to provide liquidity while tick size and volatility combine to provide opportunity. The Russell 2000 has traded with a $100 multiplier or $10 per tick since its inception. When we combine the multiplier with the average trading range of around 18 points per day, we can calculate a day trading opportunity of approximately $1,800. For the sake of comparison, the min-S&P 500 has a $50 multiplier and $12.50 tick size with an average daily range of 16 points. This equals $800 in daily trading opportunity. Finally, the margin on the Russell 2000 was only about 20% more than the mini-S&P 500, which is a bargain considering there's more than twice the potential daily profit.
![COT Free Trial[1] copy](https://waldocktrading.com/wp-content/uploads/2016/09/COT-Free-Trial1-copy.jpg) These characteristics have attracted a substantial speculative following in the Russell 2000 and had helped the Intercontinental Exchange(ICE) gain market share on the CME Group(CME). However, as prices climb, the standard daily average move becomes larger in a Dollars and Cents manner even though volatility has remained steady. This caused the contract to grow too big on a tick scale so; the ICE cut the contract size in half on December 5th. This is standard operating procedure among the exchanges. Specifically in the stock indices where the general trend is higher for decades on end. When I first started trading the S&P 500 on the floor of the CME, the Index was in the 300's, and we traded $25 ticks every nickel. So, the point size was $500. Using the S&P numbers from above this would equal an average daily range worth $8,000 rather than the $800 it is now. As you can see, through cutting the tick size and eventually introducing the mini-S&P 500 contract, the CME has managed their flagship contract to maintain speculative interest in spite of the contract's 750% gain since I started trading.
These characteristics have attracted a substantial speculative following in the Russell 2000 and had helped the Intercontinental Exchange(ICE) gain market share on the CME Group(CME). However, as prices climb, the standard daily average move becomes larger in a Dollars and Cents manner even though volatility has remained steady. This caused the contract to grow too big on a tick scale so; the ICE cut the contract size in half on December 5th. This is standard operating procedure among the exchanges. Specifically in the stock indices where the general trend is higher for decades on end. When I first started trading the S&P 500 on the floor of the CME, the Index was in the 300's, and we traded $25 ticks every nickel. So, the point size was $500. Using the S&P numbers from above this would equal an average daily range worth $8,000 rather than the $800 it is now. As you can see, through cutting the tick size and eventually introducing the mini-S&P 500 contract, the CME has managed their flagship contract to maintain speculative interest in spite of the contract's 750% gain since I started trading.
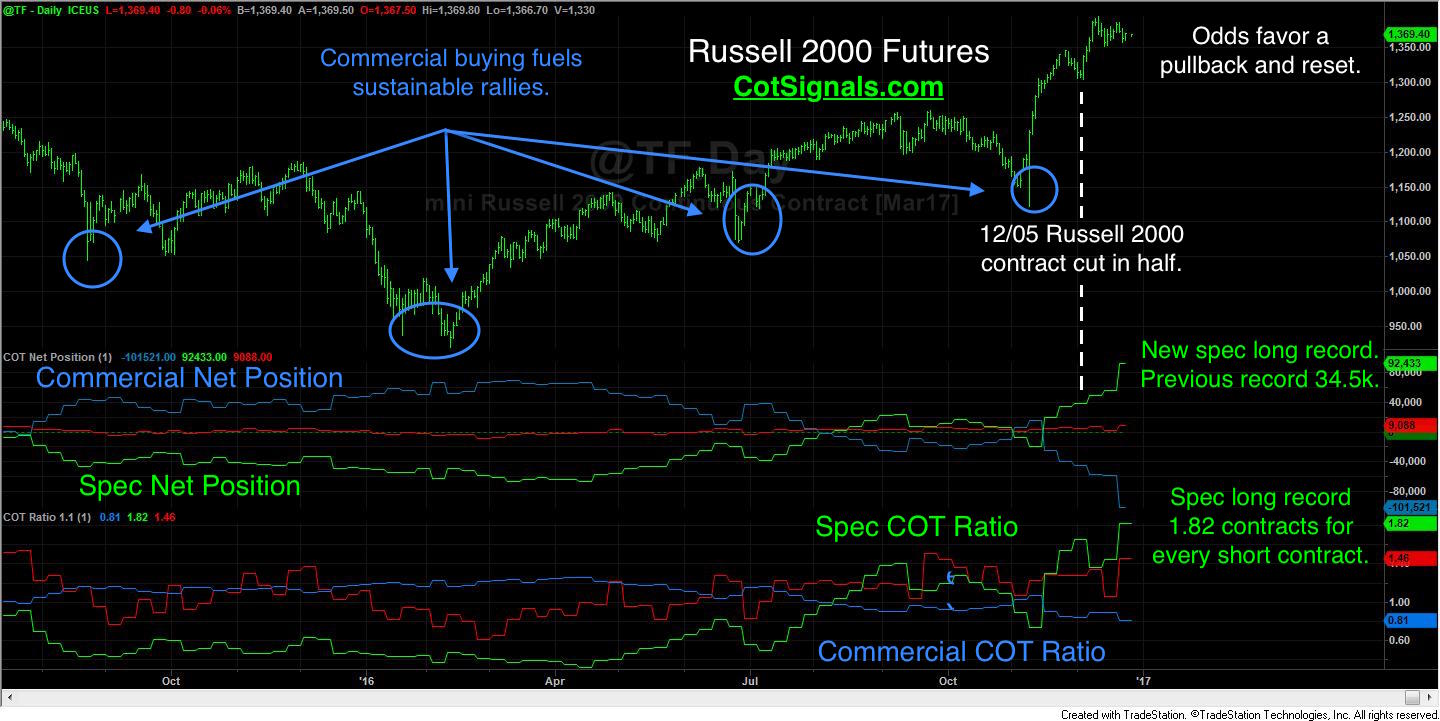
Now, moving to the chart below, you can see that the net positions have gone crazy. On first blush, the record-setting positions would be newsworthy in and of themselves. However, the fact that the speculative total position has increased by 180%, rather than the 100% that would be expected since the tick size was cut in half suggests that the real story may lie in the opposing actions between the commercial and speculative traders. Furthermore, the speculative net position has increased by more than 250% to a new record high and sets a spec COT Ratio record of long 1.82 contracts for every contract they're short. By any measure, the speculative population must surely be running out of new buyers.

Conversely, the commercial side of the ledger has not seen the same swell since the contract split on December 5th. The commercial traders are still 20% below their previous total position record of 1.18 million contracts. Therefore, we will need a new total position record in excess of 2.36 million contracts to officially set a new commercial total position record using the current contract value. The result of this is that commercial traders are collectively sitting on a ton of selling pressure. My guess is they wait for January to see just how far the speculators can push the market before the commercial traders begin to hedge their long equity positions by selling the Russell 2000 futures. We'll stay abreast of this development and update with appropriate trading signals via our nightly email at CotSignals.com.


