

The power of today's computing makes finding seasonal patterns relatively easy. It's straight forward to find a buy date and a sell date with an 85% winning percentage over the last whatever the number of years. While many retail traders will take a look at the numbers and jump at the action, many times a more in depth look reveals that the trade is merely a numerical coincidence with no recurring fundamental cause to have affected the market's performance during this period. Today, I'll show you the evolution of the seasonal pattern in soybeans and the increased focus and accompanying volatility now associated with the February USDA Supply & Demand report.
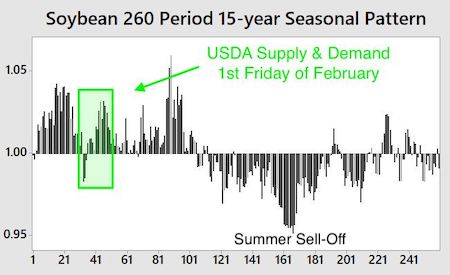
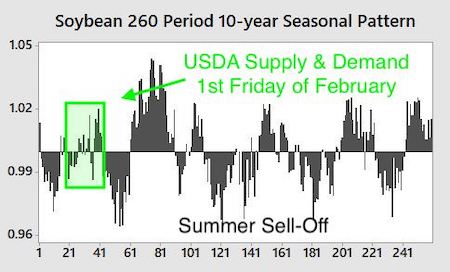
Historically, fear in the soybean market has been more focused on harvest than planting. Fear has shifted significantly as modern farming techniques can get the crop out of the ground in increasingly shorter periods. However, modern farming can't prevent a late planting dictated by Mother Nature. We'll look at four charts. The first two are the seasonal patterns for soybeans. The second two allow us to measure volatility relative to seasonality.
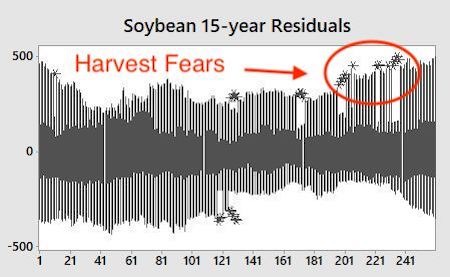
The next two charts focus on volatility. The highlighted portions show historical market data beyond the bounds of the volatility expected for the given seasonal period.
The 15-year chart shows that harvest time accounted for the most volatile period of the year. Fear shifted over the last ten years as the industrial farming complex has become more efficient. Mother Nature is still the dominant force, and she has everyone focused on planting time.
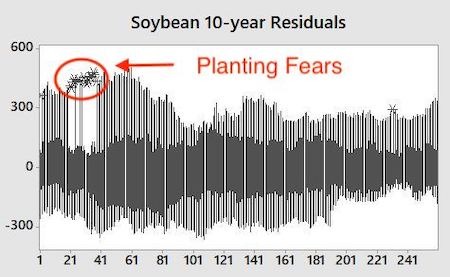
Notice the red circle on the last chart? That's the period centered on the February 8th USDA Supply and Demand report. Most of the volatility during this period has led to higher prices into and following the announcement.
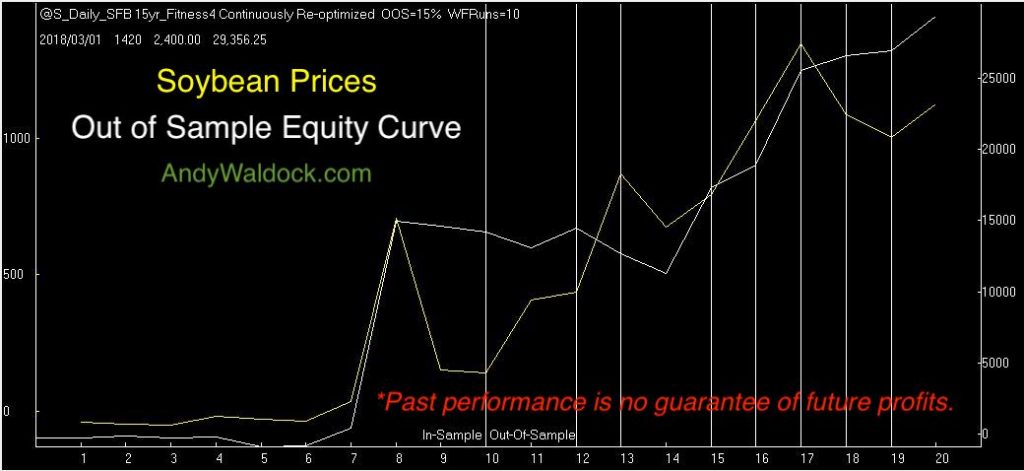
We plan on taking a long position in March soybeans over the next week, and hold the position through the report. The out of sample equity curve begins with trade number ten.
Finally, because seasonal modeling is difficult due to the dearth of data, we always defer to the Monte Carlo sampling to determine what to expect concerning average movement and most importantly, maximum adverse excursion to determine if the risk justifies the reward. We tend to look for about a historical two to one ratio accompanied by a solid winning percentage.
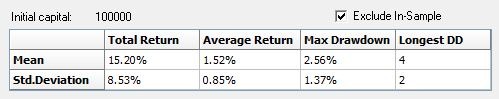
This soybean strategy has won better than 60% of its modeled trades and has an average return nearly twice its standard deviation. This means that even if this trades underperforms, there's still a good chance it will end profitably. I used a $100k model account in the testing to make the percentages in the table easily convertible to dollar values. We expect the initial risk to be near 3% of the current market price so, roughly $.30 in the futures markets or, $1,500 per contract. Finally, this trade can also be executed by ETF traders watching funds like, "SOYB" the Teucrium soybean fund.
Join our Seasonal Program for $35 per month before the price goes up in March. I'll send you the entry, protective stop and tell you when to exit for all of our seasonal trades, including the trade we're waiting for in, "The Shifting Seasonality of Natural Gas."


