
We'll take a big picture look at the gold market this week and the interplay between the market's players and price before finishing with an option play that could capitalize on multiple factors leading to increased volatility in the December gold futures contract. Finally, this piece will be short on words and long on charts as we distill the action from monthly down to daily resolution.
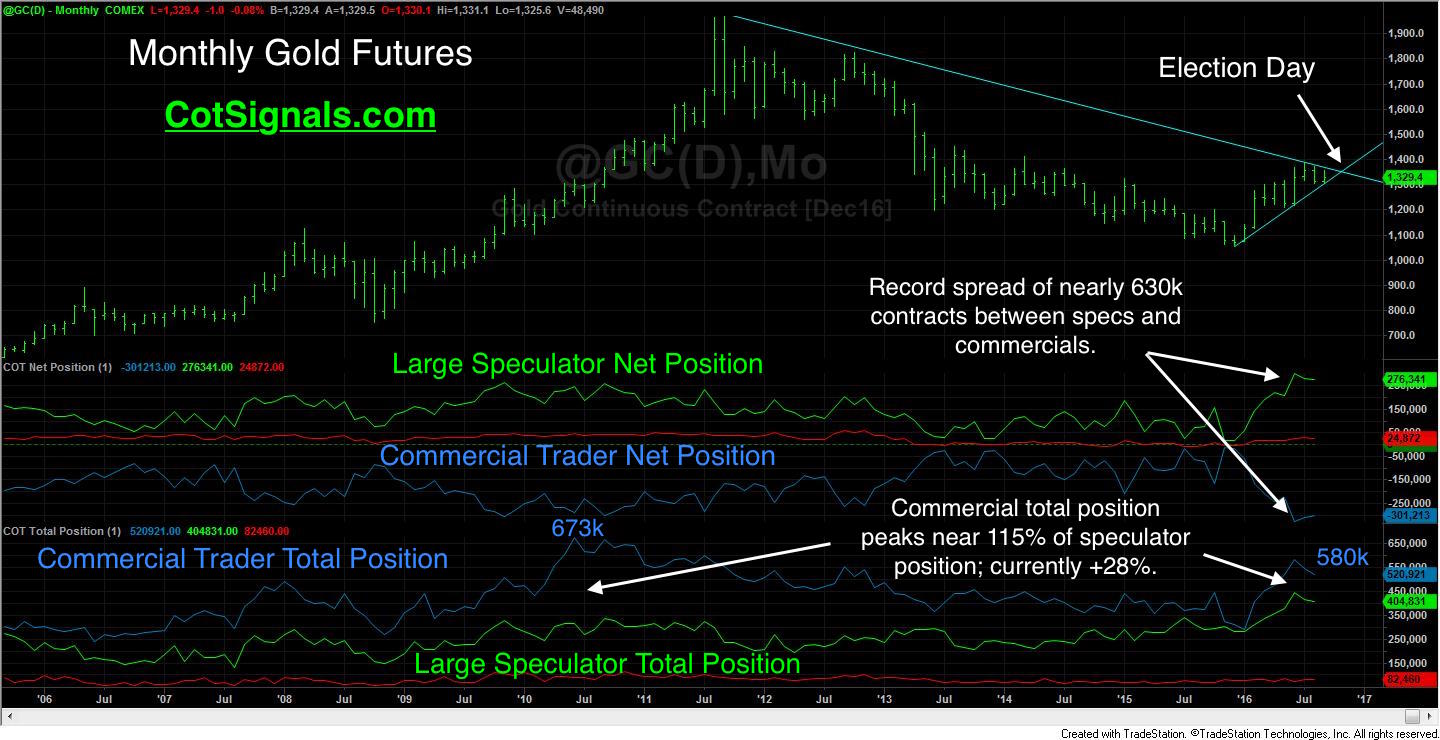
Beginning with the monthly chart and the broadest of brushstrokes, we want to note the downward sloping trendline starting at the high made in 2011, near $2,000 per ounce. That trendline stands at $1,360 for the month of October and drops to $1,340 for the month of November. Also, make a note of the total position sizes in the bottom pane. This reflects the sum of long and short positions of speculative and commercial trader categories. Total position serves as a proxy for capacity, especially on the commercial side as it reflects the actions of both the miner and the processing industries. Thus, we know that the total capacity for the gold industries' hedging activities in the futures markets is around 673,000 contracts. Meanwhile, the large speculators' total position can theoretically grow to infinite proportions. Occasionally, like in 2010, the speculative herd mentality overruns the value-based actions of the commercial traders. In times of, "mania," it's much harder to create new gold mines or spur end line demand to increase total industrial capacity than it is to attract another speculator to the market. This is why we combine net and total position data into the COT ratio filter applied to our mechanical Commitments of Traders futures programs.
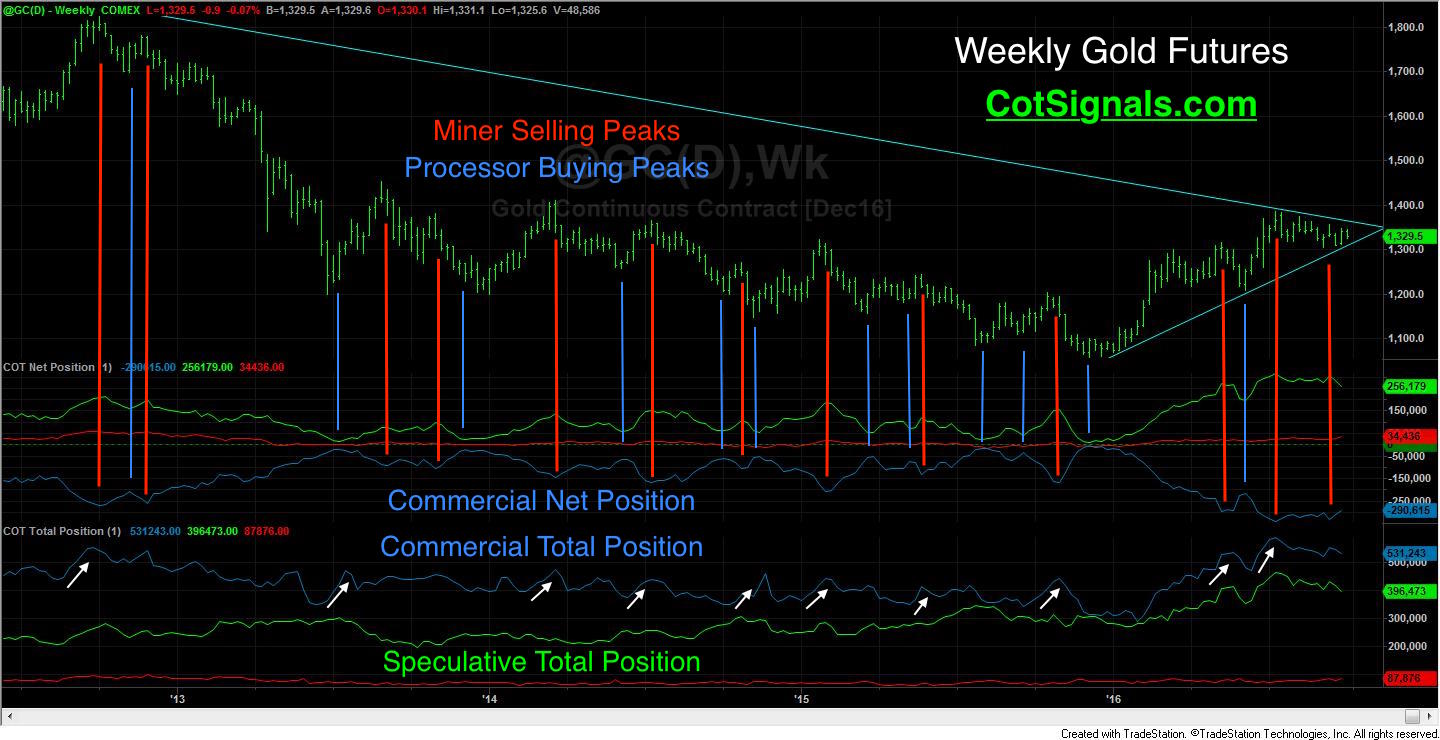
Now that we have an idea of where we stand let's take it one step deeper with the weekly chart. This chart helps break down the commercial trader behavior into manageable chunks. The commercial trading group is made up of two groups; the miners and the processors. Miners take action on the sell side to lock in forward prices for the gold they expect to produce while processors use the buy side of the futures market to lock in the necessary raw supply flows.
The gold market's five-year downward trend has put the gold miners on the defensive. The red vertical lines represent miner selling pressure while the blue vertical lines represent processor purchasing activity. You can see that gold miners have been the major actors in this market as the total position size has grown with each spike of commercial selling pressure. Considering that the commercial trader total position size has been anywhere from 25% - 115% larger than the speculators' total position, it makes sense the commercial traders' actions are the most prominent at the market's turning points simply because of their size advantage. This type of relationship is exactly what we'd expect to see in a bear market like gold that has sold off anywhere from one-third to one-half over the last five years.
![COT Free Trial[1] copy](https://waldocktrading.com/wp-content/uploads/2016/09/COT-Free-Trial1-copy.jpg)
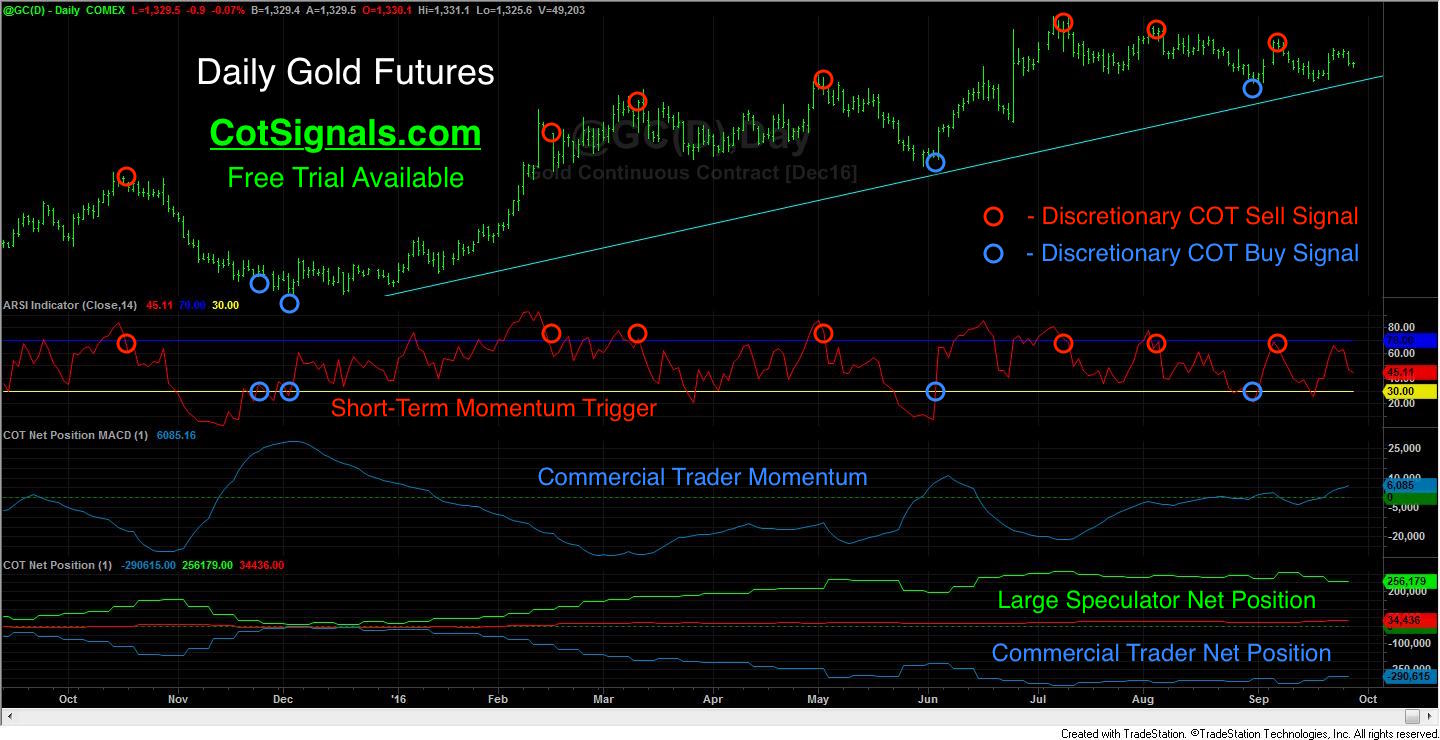
Dropping this down to daily resolution and the timeframe we trade, sets up the actual buys and sells for this methodology over the preceding year. Most importantly, note the coherence between the three timeframes. This is why we use their actions as our primary value determinate.
The daily chart provides the full setup for our Discretionary COT Signals. It's a very simple, three-step process. First, we only take trades in line with the commercial traders' momentum. We look for buying opportunities when commercial momentum is positive and selling opportunities when commercial momentum is negative. Secondly, we wait for our proprietary, short-term momentum indicator to become overbought or, oversold against the commercial traders' momentum. This creates tension in the market and sets the trigger for the trading signal. Finally, once our momentum indicator reverses from overbought/oversold back in line with the commercial traders' momentum, we execute the trading signals, which you see plotted on the daily chart. The reversal also provides us with the swing high or, low that we'll use as a protective stop point.
This brings us to the current situation and our gold play through the Presidential election on November 8th. The spread between the commercial and speculative positions is near an all-time high, which indicates that there is a significant difference of opinion between the prices those in the gold industry expect to see going forward versus the prices the large speculators are expecting. This divergence of views is being fueled by significant Dollars as both sides are stepping up to the plate to create their record and near-record positions. In fact, the speculators set a new bullish record at nearly six long contracts for every single short contract in early September. In spite of this, neither side has been able to break the market free of its congestion as bound by the recurring trendlines. This has caused volatility to collapse.
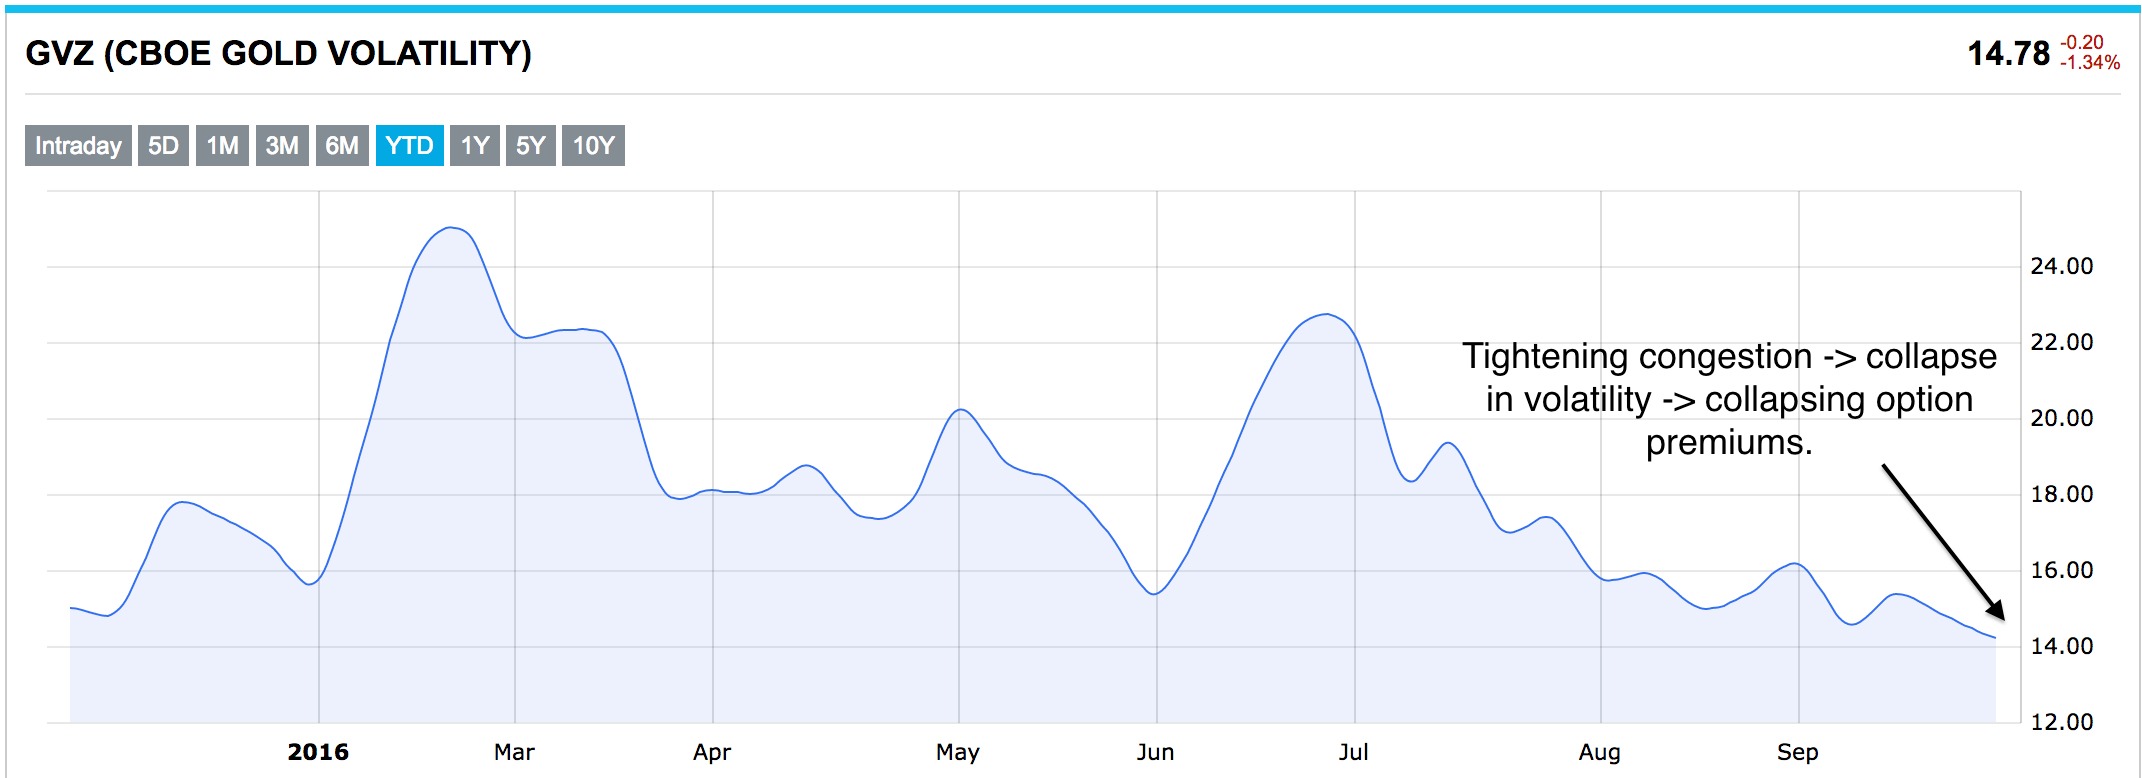
The collapse in volatility has resulted in the dramatic decline of premium in December gold options. The December gold futures options expire on November 18th. This provides ten days of post-election action for the market to make up its mind and determine a winner in the epic battle playing out between the large speculators and the commercial traders. The gold futures market's consolidation lies between the trendlines now at $1,360 and $1,310. The market is near $1,330 as I write and that marks the December $1,300 put near $17.00 ($1,700 cash value) and the December $1,360 call near $15.50 ($1,550 cash value). Buying a call option and a put option is called a straddle. The call gives the owner the right to be long the futures above $1,360 or, short the futures below $1,310. This straddle can be bought for $32 or, $3,200 in premium plus your commissions and fees. Therefore, the market will have to be above $1392 or, below $1,278 to be profitable at expiration. Finally, there may be no reason to hold the trade this long once the market breaks out. Either way, we feel the gold market's decline in volatility compared to the size of the bets being waged within it will be short-lived as we near November 8th.


