

We just took a new and currently profitable position in gold. Before year-end, we'll initiate silver and platinum trades based on the information below. Last year, we made nearly $4k on the platinum trade but lost $1,675 on the silver deal.
How will this year's trades perform? I have no idea. However, I'll show you the research I'm using to put my money behind these trades, as well as a nerd's view of the data differences between the two trades. If our approach to seasonality interests you, sign up, I'll send you the same signals and orders I'll have working in my account at our brokerage, Commodity & Derivative Advisors.
We're lumping the silver and platinum trades together because their entries could trigger any day. I meant to get the research out over the weekend, but holiday shopping and family obligations limited my publishing opportunities. The primary difference between the two trades is the winning percentage. The platinum trade has performed more consistently than the silver futures.
We perform our seasonal analysis in many different ways. The limited string of serial data in annual review makes it essential to separate data-driven algorithm development from trading performance profits and losses. The lookback period in the seasonal analysis is limited to a single string of data resulting in a typical sample size of 15 or fewer events. Today's computing power makes it reasonably easy to generate adequate trading performance metrics based on nothing more than computational optimization. That alone would be garbage in, garbage out. Below, you'll see statistics for the student T-test that helps us determine if the data window we're viewing behaves differently from the data as a whole, as well as how confidently we can assume that our data is different from its general population.
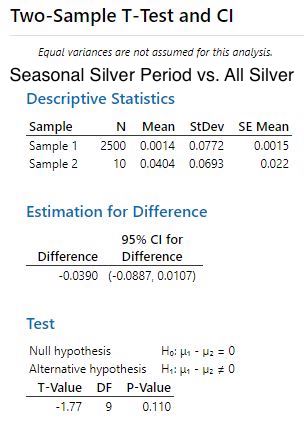
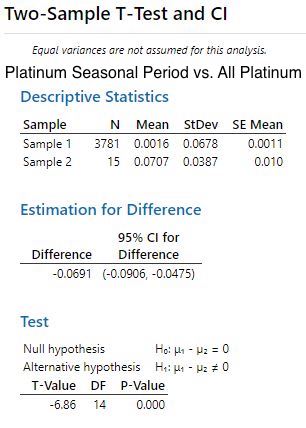
Both the silver and platinum data show significant T-Values but, the Silver's P-Value discounts the significance of its T-Value. The difference is much easier to see in the graphs below.
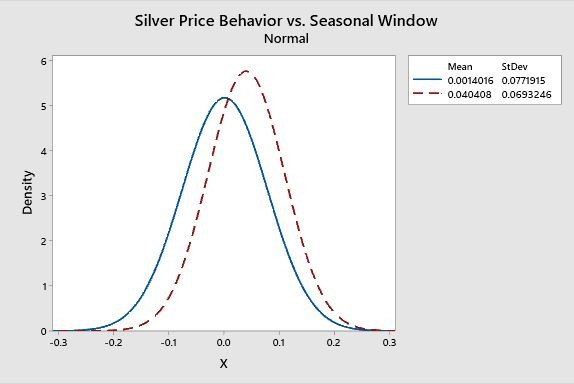
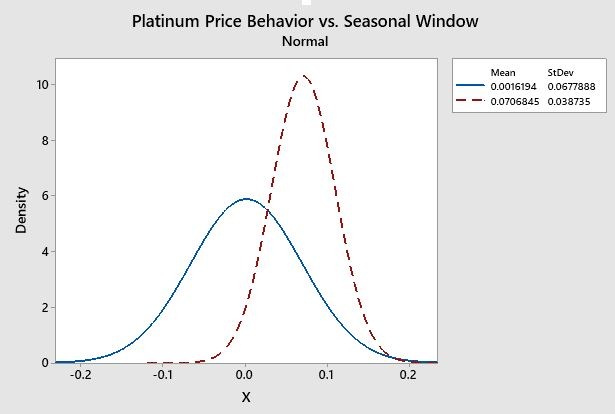
Note the significant differences between the selected window of platinum data and the respective closing prices of all platinum data. The statistical differences between the silver and platinum trades are easy to see in the distribution charts.
We use this data to develop the models we apply and test on the historical data series. Remember that it's essential to use appropriately adjusted data when analyzing in-depth historical commodity data. Our modeling has provided us with the following out of sample results for these trades. Remember, while results are out of the sample, they are hypothetical. Of course, every seasonal commodity trade we publish is based on hypothetical results because we run new programs for each annual opportunity to take into account current market structure and volatility. That being said, commodity trading can be risky, and even though we ALWAYS trade with active stop-loss orders, trading should only be undertaken with actual risk capital. Please read the full disclaimer at the end of the blog for associated risks on commodity trading, hypothetical results, and seasonal forecasting shortfalls.
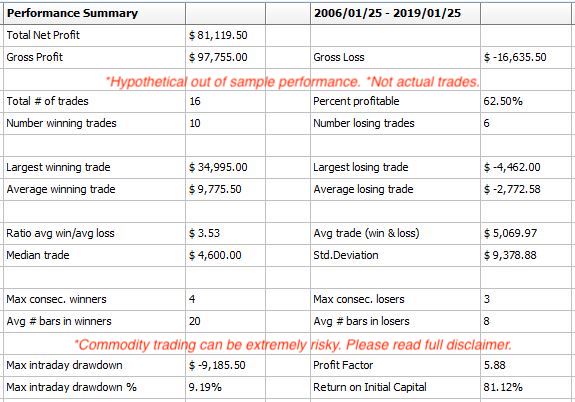
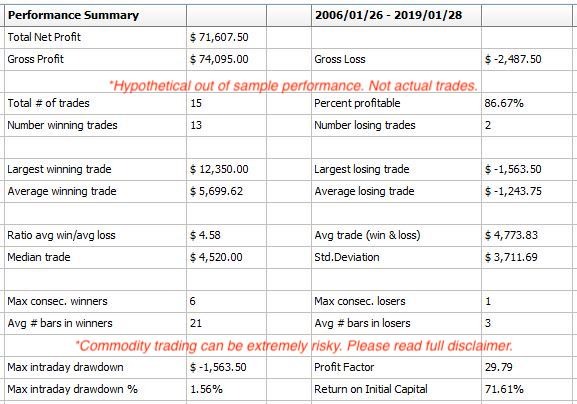
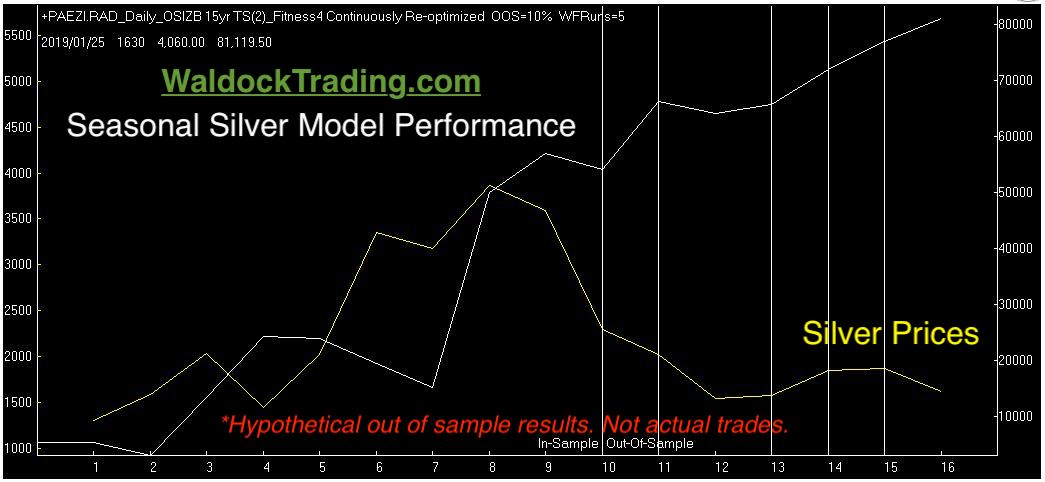
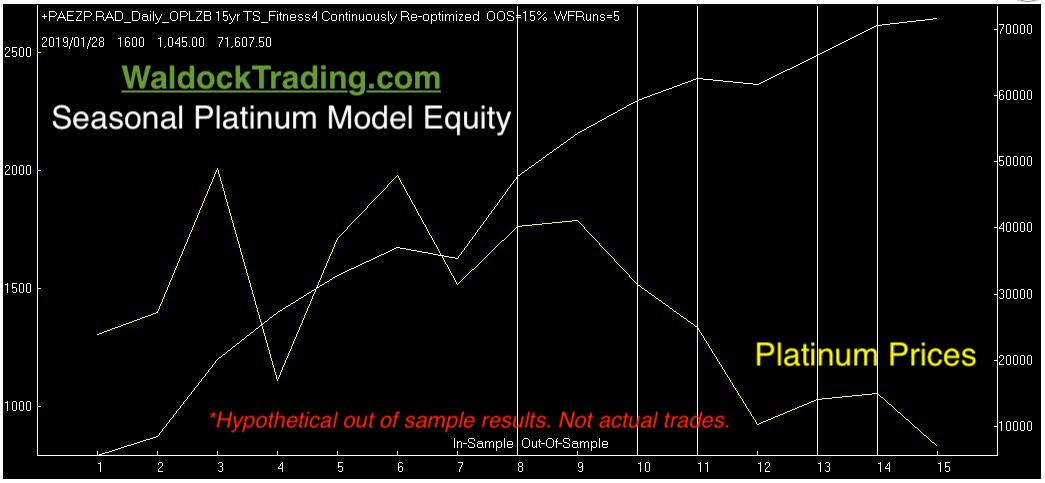
The hypothetical trade-by-trade walk-forward equity curve is next. Remember, any historical performance report on a seasonal strategy is simply a single string’s information. The numbers below are tremendous but, none of those trades actually took place. We develop a new model for every trade to account for current market conditions. Therefore, take the equity curves below with a grain of salt. We’ll risk 2.5% from our entry price in silver, and 2% in platinum. That’s nearly $2,200, with silver trading at $14.50 per ounce, and just over $900 in platinum trading at $930 per ounce. Executed stop-loss orders of this magnitude would make either equity curve look substantially different.
We always close with the Monte Carlo simulation data. As mentioned earlier, we build a new model with each trade. We do this to address the small sample size of an annual event. Since we can’t create more years and seasonality 30 years ago isn’t the same as seasonality today, we focus on the last 15 years. Then, we allow the computer to randomize our entry and exit dates over a given range. We use this information to try and find the sweet spot of 100,000 tests.
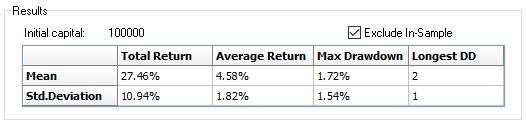
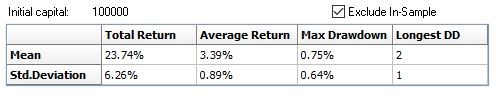
Now, let’s compare the historical results to the Monte Carlo results. Historically, we expect to return 4.58% and 3.39% on $100,000 in March silver and April platinum, respectively. That, in itself, is an edge worth trading. However, using the Monte Carlo analysis, we can create an out of sample forecast based on 100,000 timelines. These tests suggest that a more realistic expectation is a rally in silver and platinum prices between 2.76% and 6.4% in silver, and 2.5% and 4.28% in platinum two-thirds of the time based on the mean rise and standard deviation.
Finally, factor the reasonable winning percentage in silver and the high winning percentage in platinum, and I’ve produced a fully developed seasonal trade plan for the year-end metal rallies.
Subscribe to receive our sell signal, protective stop level, and position management commentary (including exit) once the trade is triggered.
See our Recent Trades.
Seasonal Research Disclaimer:
“Seasonal tendencies are a composite of some of the most consistent commodity futures seasonals that have occurred in the past several years. There are usually underlying, fundamental circumstances that occur annually that tend to cause the futures markets to react in similar directional manner during a certain calendar year even if a seasonal tendency occurs in the futures, it may not result in a profitable transaction as fees and the timing of the entry and liquidation may impact on the results. No representation is being made that any account has in the past, or will in the futures, achieve profits using these recommendations. No representation is being made that price patterns will recur in the future.”
Hypothetical Results Disclaimer:
“Hypothetical or simulated performance results have certain inherent limitations. Unlike an actual performance record, simulated results do not represent actual trading. Also, since the trades have not actually been executed, the results may have under or over-compensated for the impact if any, of certain market factors, such as lack of liquidity. Simulated trading programs in general are also subject to the fact that they are designed with the benefit of hindsight.”
