I intend to take positions in gold, silver, and platinum before year-end. Last year, these three trades combined to produce more than $6,000 on a single contract basis, while winning two out of the three trades. How will this year's trades perform? I have no idea. However, I'll show you the research I'm using to put my money behind these trades and, if you sign up, I'll send you the same signals and orders I'll have working in my account at our brokerage, Commodity & Derivative Advisors.
The first trade will be in the gold market. I'll trade the April gold futures. However, gold ETFs like GLD or the leveraged DGLD should behave similarly. We made more than $4k on this trade last year, and as you'll see from the figures below, that was a little less than expected. The Monte Carlo testing suggests gold should move higher by over 6% during the five weeks we plan to hold the position.
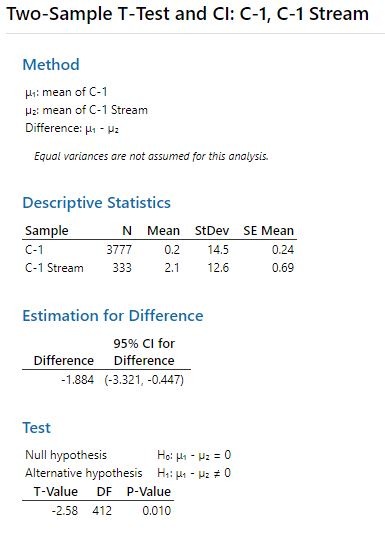
We measure seasonality in several ways other than Monte Carlo testing, as well. The table displays the statistical behavior of 15-years of ratio adjusted gold data versus the slice of time we want to own. Now, admittedly, the student T-Test isn't the latest in artificial intelligence. However, it is good intelligence because sometimes, seasonal data may show a series of wins or losses due to randomness rather than statistical significance. So, the table below shows that our little slice of data is different than the gold market as a whole at the 95% confidence interval. Our slice also has a higher mean and less negative skew than the sample as a whole. This combination shows our window of opportunity has an upward bias over the general data pool.
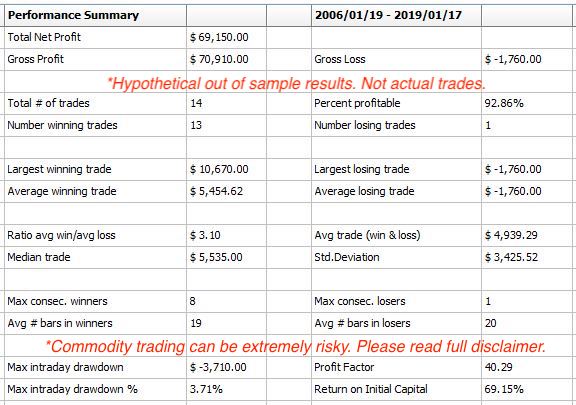
Our modeling has provided us with the following out of sample results for this trade. Remember, while results are out of the sample, they are hypothetical. Of course, every seasonal commodity trade we publish is based on hypothetical results because we run new programs for each annual opportunity to take into account current market structure and volatility. That being said, commodity trading can be risky, and even though we ALWAYS trade with active stop-loss orders, trading should only be undertaken with actual risk capital. Please read the full disclaimer at the end of the blog for associated risks on commodity trading, hypothetical results and seasonal forecasting shortfalls.
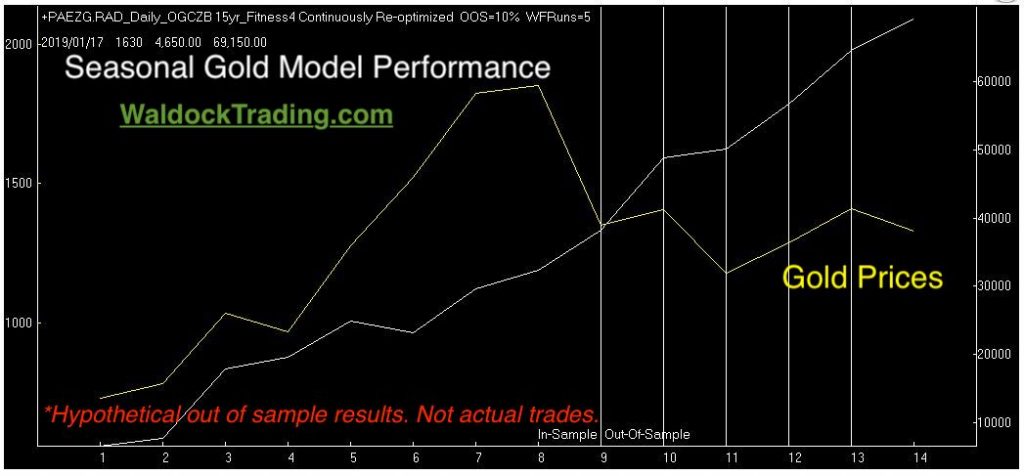
The hypothetical trade-by-trade walk-forward equity curve is next. Remember, any historical performance report on a seasonal strategy is simply a single string's information. The numbers below are tremendous but, none of those trades actually took place. We develop a new model for every trade to account for current market conditions. Therefore, take the equity curve below with a grain of salt. We'll risk 4.5% from our entry price. That's nearly $7,000, with gold trading at $1,500 per ounce. An executed stop-loss order of that magnitude would make the equity curve look substantially different.
We always close with the Monte Carlo simulation data. As mentioned earlier, we build a new model with each trade. We do this to address the small sample size of an annual event. Since we can’t create more years, and seasonality 30 years ago isn’t the same as seasonality today, we focus on the last 15 years and allow the computer to randomize our entry and exit dates over a given range. We use this information to try and find the sweet spot of 100,000 tests.
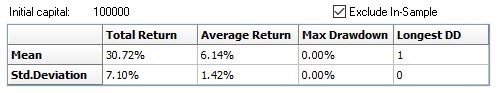
Now, let's compare the historical results to the Monte Carlo results. Historically, we expect to return 6.14% on $100,000. That, in itself, is an edge worth trading. However, using the Monte Carlo analysis, we can create an out of sample forecast based on 100,000 timelines. These tests suggest that a more realistic expectation is a rally in gold prices between 4.1% and 5.04% two-thirds of the time based on the mean rise and standard deviation. That equals a single contract projected increase between $6,150 and $7,560 in the 100 ounce April gold futures contract.
Finally, factor the high winning percentage, and I've produced a fully developed seasonal trade plan for the year-end gold rally. Stay tuned for silver and platinum trade plans later this month.
Subscribe to receive our sell signal, protective stop level, and position management commentary (including exit) once the trade is triggered.
See our Recent Trades.
Seasonal Research Disclaimer:
“Seasonal tendencies are a composite of some of the most consistent commodity futures seasonals that have occurred in the past several years. There are usually underlying, fundamental circumstances that occur annually that tend to cause the futures markets to react in similar directional manner during a certain calendar year even if a seasonal tendency occurs in the futures, it may not result in a profitable transaction as fees and the timing of the entry and liquidation may impact on the results. No representation is being made that any account has in the past, or will in the futures, achieve profits using these recommendations. No representation is being made that price patterns will recur in the future.”
Hypothetical Results Disclaimer:
“Hypothetical or simulated performance results have certain inherent limitations. Unlike an actual performance record, simulated results do not represent actual trading. Also, since the trades have not actually been executed, the results may have under or over-compensated for the impact if any, of certain market factors, such as lack of liquidity. Simulated trading programs in general are also subject to the fact that they are designed with the benefit of hindsight.”