When I was first introduced to Tradestation in the late 90's, I couldn't believe there was now the means to quantifiably test everything I'd learned as a local in the S&P 500 pit. I quickly learned two things. First, much of what I learned were good sound bites but iffy trading strategies. Secondly, many of the successful techniques that worked weren't so easy to program. The human eyeball is still the best tool when it comes to spotting some standard setups. Today, we'll discuss a bearish divergence in the fundamentally weakening copper futures.
Pattern trading is as old as marking the highest or, lowest sales whether measured in Dollars, Yen, Pounds or gold, silver, and copper. Over the years, computers and programming have advanced considerably but translating multiple what the eyeball sees and the brain processes into the binary language of computers has been a tedious process, at best. The chart below, while complicated to setup, is exceptionally simple for the eyeball to pickup and the mind to translate.
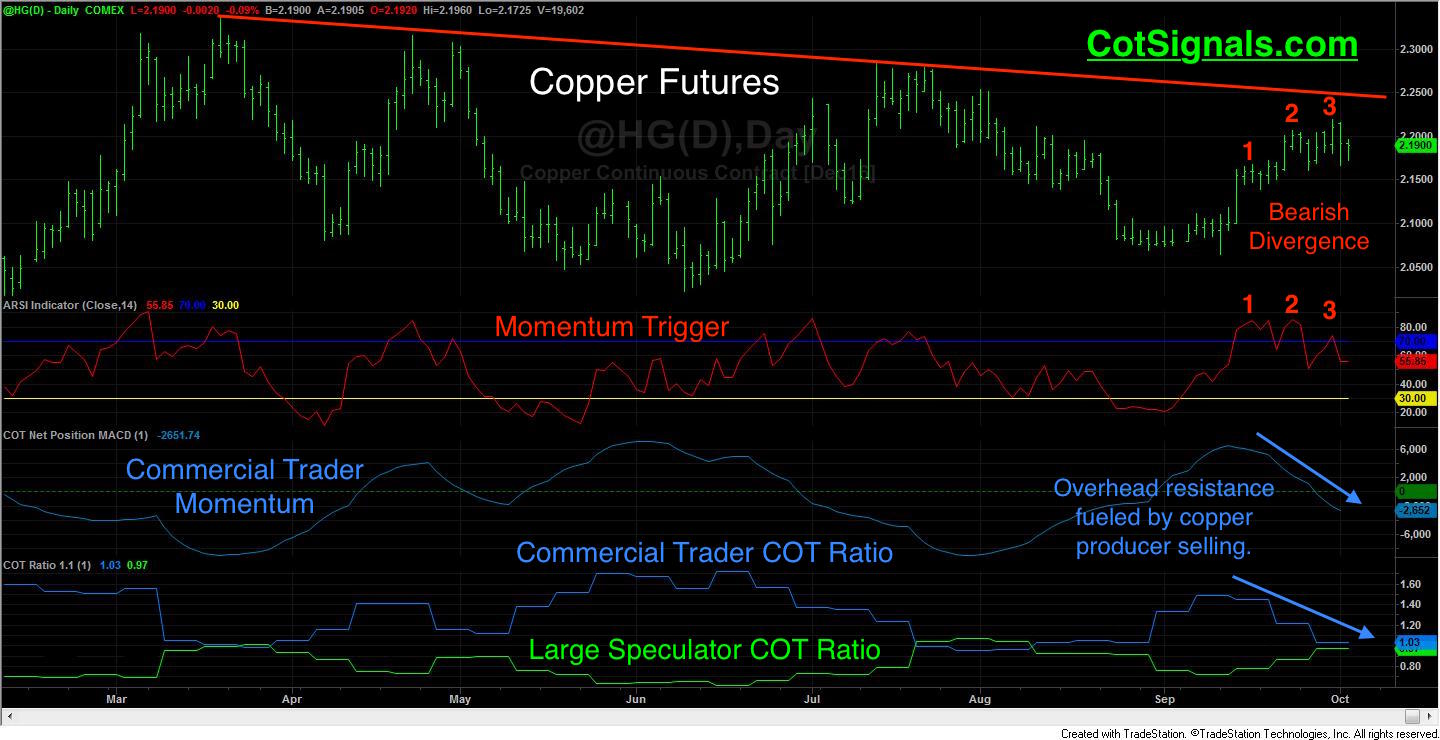
The first plot is the daily copper futures. You can see that the market has been in a broad downward trend since this spring as bound by the downward sloping trend line. Over the last month, the market has made three moves towards this resistance, which now comes in around $2.25. The second plot contains our proprietary momentum trigger. Note that momentum has not confirmed the recent rally by making new highs of its own. A higher high price in the face of declining market momentum remains the classic technical analysis definition of, "bearish divergence."
![COT Free Trial[1] copy](https://waldocktrading.com/wp-content/uploads/2016/09/COT-Free-Trial1-copy.jpg) A bearish divergence is not enough to trigger a trade. We still need some sense of value; an idea of why market momentum isn't confirming the price action. We focus on the decisions of the commodity producers and consumers to determine the market's value area. The more anxious copper miners are to sell their forward production; the higher the likelihood that the recent rally is transitory. Conversely, when copper refiners are anxiously jumping in on the buy side to ensure future raw material supplies; the more likely it is that we are heading towards higher prices. The commercial traders are exceptionally good at playing the market's sideways meanderings with both the producers and the refiners taking appropriate stands to enhance their bottom lines. Finally, note the recent and decisively negative turn in their momentum in the third pane of the chart.
A bearish divergence is not enough to trigger a trade. We still need some sense of value; an idea of why market momentum isn't confirming the price action. We focus on the decisions of the commodity producers and consumers to determine the market's value area. The more anxious copper miners are to sell their forward production; the higher the likelihood that the recent rally is transitory. Conversely, when copper refiners are anxiously jumping in on the buy side to ensure future raw material supplies; the more likely it is that we are heading towards higher prices. The commercial traders are exceptionally good at playing the market's sideways meanderings with both the producers and the refiners taking appropriate stands to enhance their bottom lines. Finally, note the recent and decisively negative turn in their momentum in the third pane of the chart.
The final piece of this setup is our COT Ratio in the bottom pane. We combine the trading groups' net and total positions into a ratio that approximates the balance between the market's ebbs and flows due to commercial traders' hedging activity versus a market that has stretched beyond expected value levels and physical usage capacity due to speculative fever. Currently, it shows us that the copper miners are actively hedging their forward production as they don't expect prices to remain this high. This aligns with the copper processors who are clearly unwilling to step up to the buy side at this level.
Therefore, we'll sell December copper futures against the recent high at $2.2190. We'll attempt to ride it down towards the $2.10 area and see if that entices the refiners back to the buy side. In the meantime, look at how we have programmed our Commitments of Traders research into a mechanical trading program at CotSignals.com.