

The cocoa market has gained more than 10% in September. However, commercial selling ahead of the first harvest is the key driver behind the late September seasonal sell-off. Recent news from the Ivory Coast, the world's largest cocoa producer suggests this annual behavior is beginning right on cue. Farmers have already begun their harvest due to what has been an early crop year. We'll show you how the Ivory Coast harvest factors into the cocoa futures market's seasonal tendencies.
The cocoa harvest happens in chunks. Ripe pods are pulled to allow the next pods greater access to nutrients and sunlight. Two to three weeks later, the next round of pods are plucked. The first harvest unlocks the key to the seasonal move we'll be attempting to exploit because the first harvest is typically the largest. Volume weighting makes this harvest a major contributor to setting the annual Ivory Coast market rate.
We expect to sell December cocoa futures any day, now. The commercial traders (growers) are beginning to sell their forward crops to lock in their harvest price. We think commercial hedging will help keep the market under the $2,500 per ton level over the next couple of weeks. However, we'll wait for the market to turn lower and place a resting buy stop to protect the position once we enter.
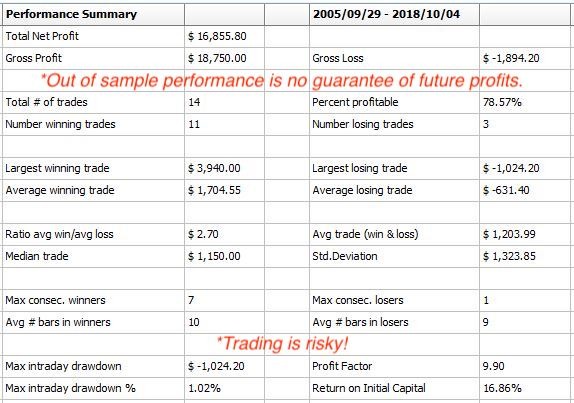
You can see that this model has been highly accurate, and the equity curve looks good, as well. Just remember that these performance statistics, though out of sample, are hypothetical. We re-run each model for each trade each year. This process allows us to factor in current market volatility, but, we lose the historical results.
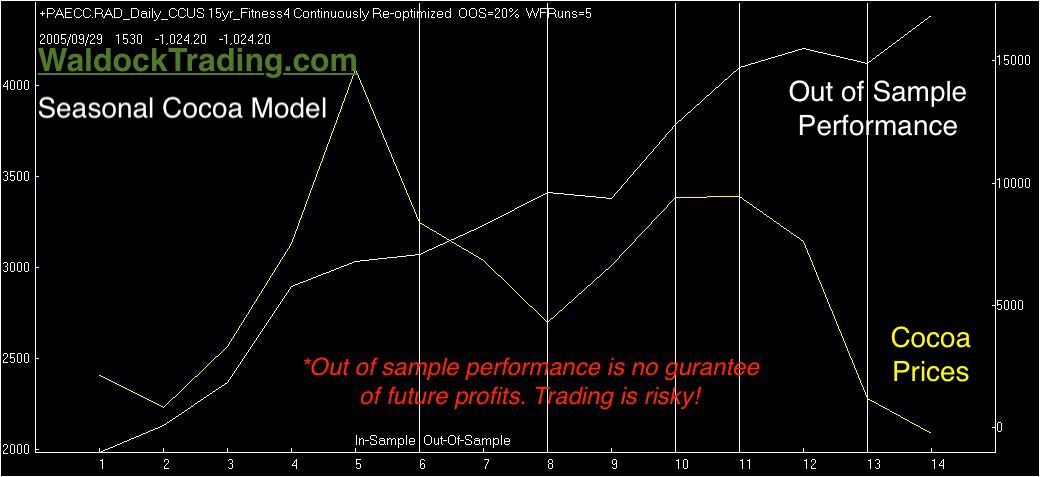
The equity curve only represents a single sequence of trades. The lone string of trades is a problem because it provides a tiny sample size. We find that Monte Carlo sampling on ratio adjusted data allows us to create a much more accurate idea of how the model performs by randomly generating 1,000 trades, rather than the 15 listed, above.
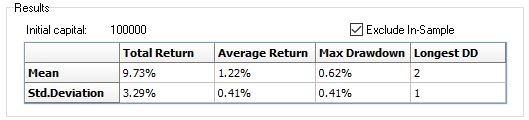
Let's look at the MC analysis. Based on our 1,000 trade population and 15 years of data, we can expect the market to move higher by an average of 1.22%. A standard distribution tells us that we can expect two-thirds of our observations to fall between +1 and -1 standard deviations from the mean. We have a 66% expectation of making between .81% and 1.63% or, $200 - $400 at current market prices.


