
The sugar market has been trending lower for more than two years. We aren't forecasting a turnaround of multi-year magnitude. However, we do know that the speculators have been pressing the short side of the market since late June. They have also run their position to a record net short level. In fact, speculators have added more than 120k short contracts in just the last month at prices between 12.30 and 10.89. Over this same period, the speculative position has grown by 140k. Another way of stating this is, "The speculators have added short positions at 7:1 pace over the last two months. Their total COT ratio is now short 1.64 contracts for every contract they are long, also a new record."
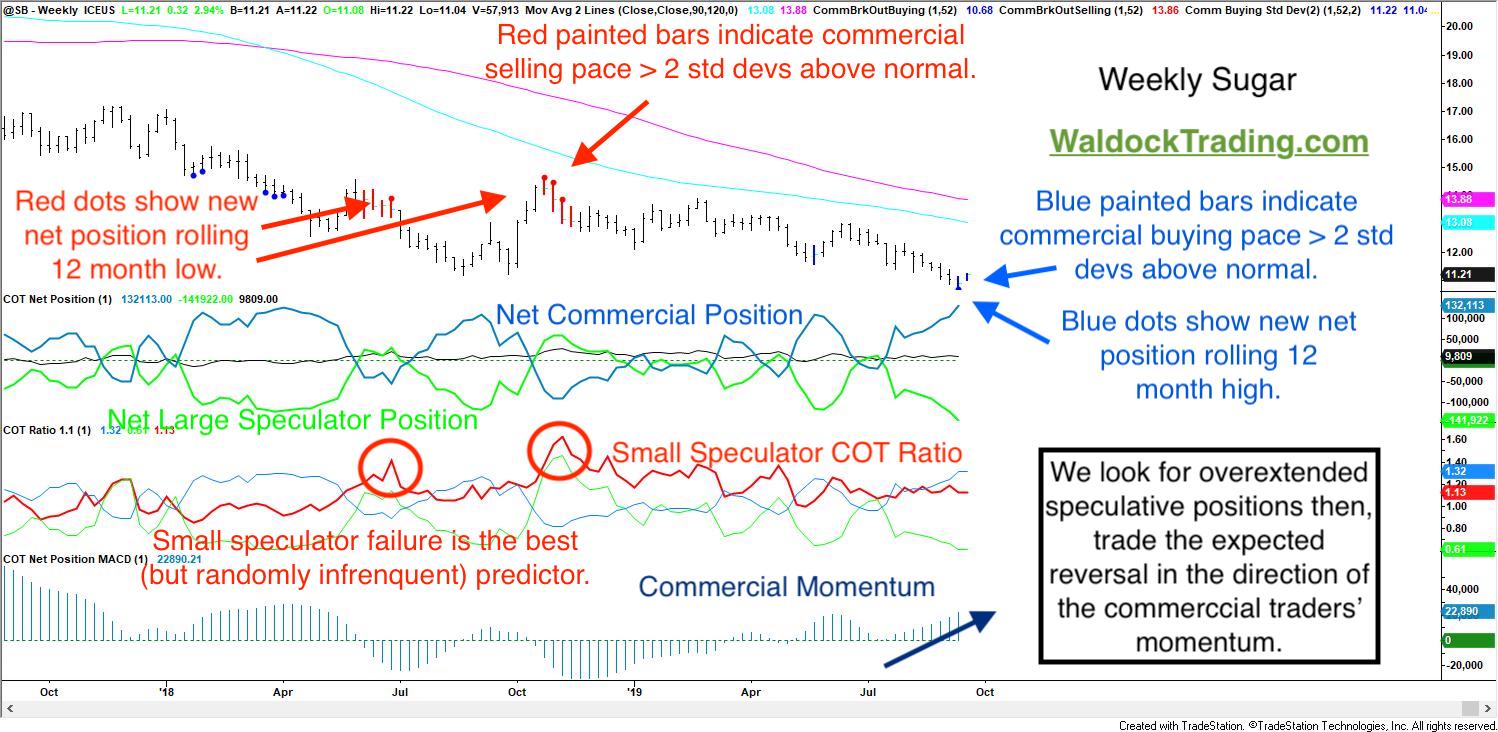
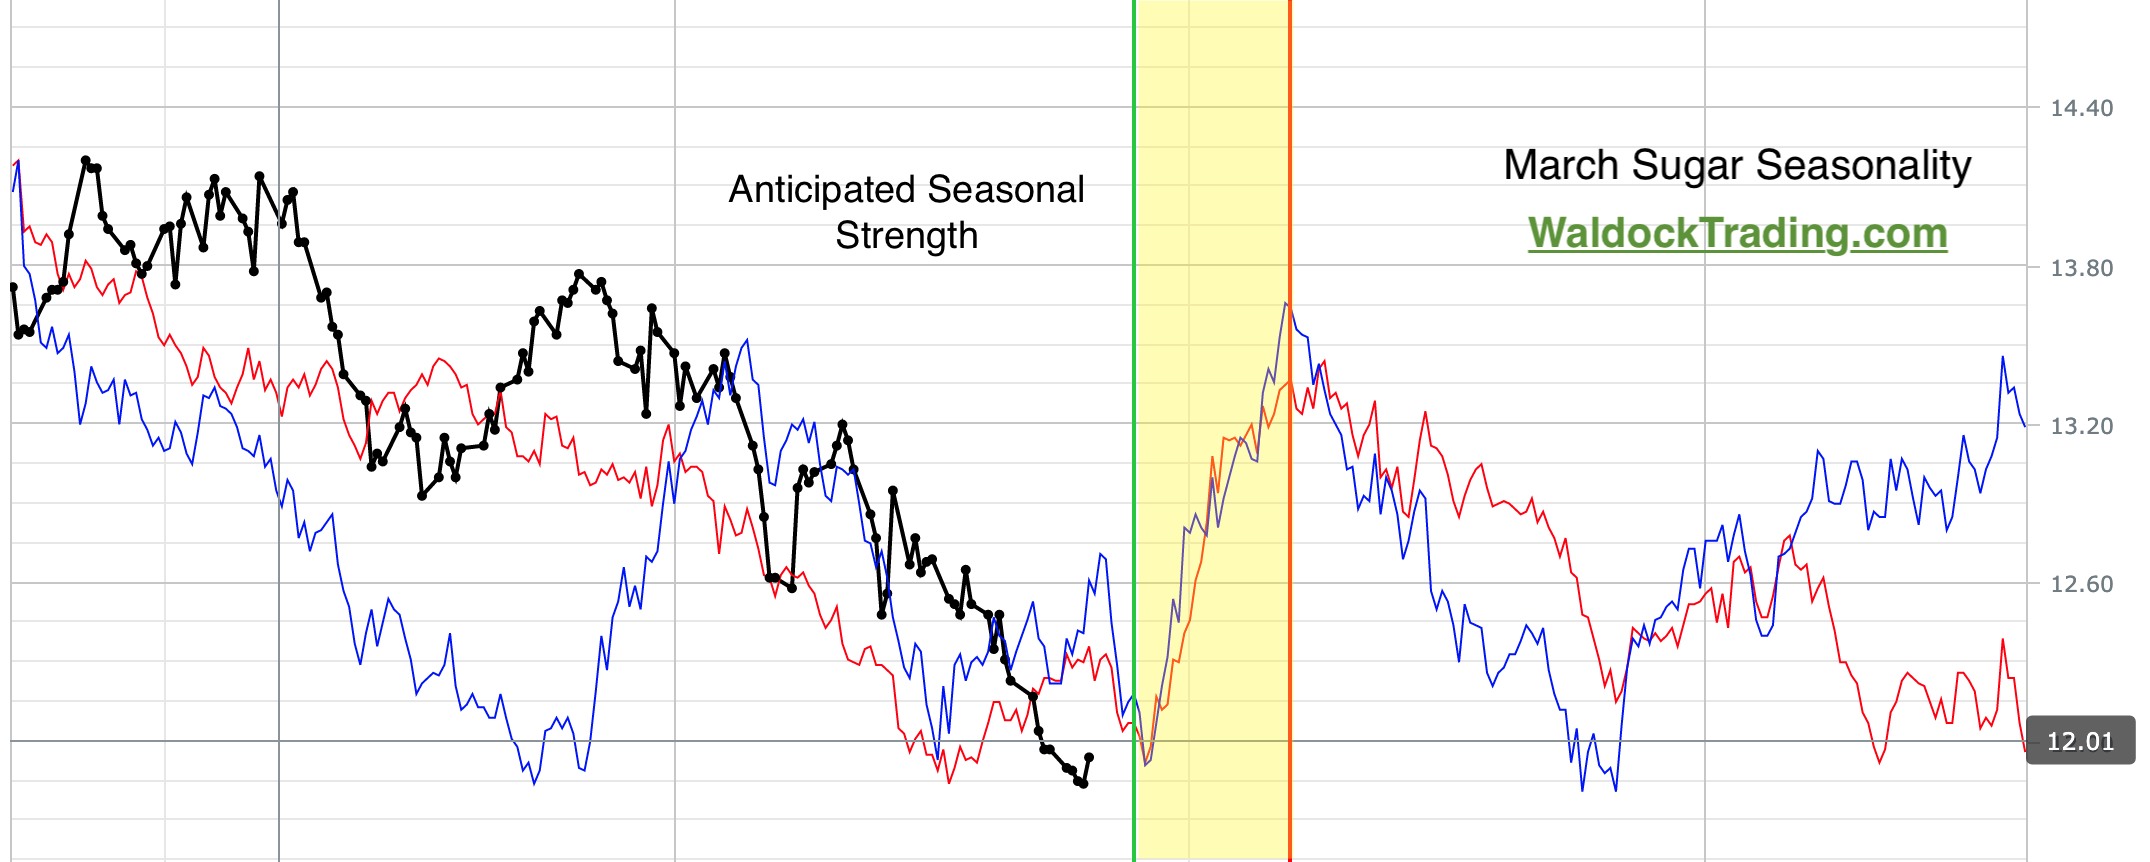
We see this as pent-up buying potential. Commercial traders have taken the opposite approach, as sugar has become a value proposition, nearing its lowest prices in 10 years and ahead of anticipated seasonal strength. We'll side with the commercial sugar processors that are locking future supplies as fast as they can. Commercial traders not only set a new net long record, but also their purchases for the last week were more than two standard deviations above their average. The commercial net position surge is just one of the ways we define "anxious." Finally, the sugar market tends to strengthen from mid-September through mid-October. We plan to piggyback this trade in our seasonal strategies.
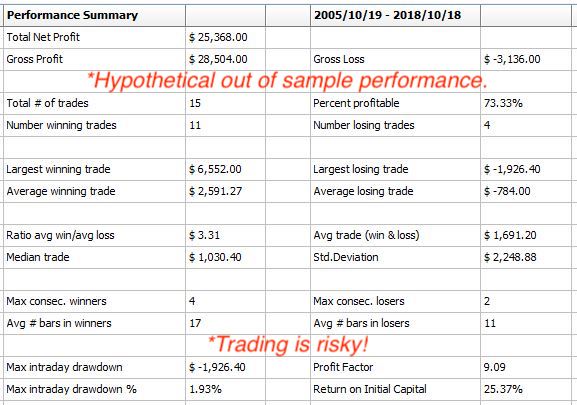
You'll see the composite performance results based on seasonality, below. The expected reversal, fueled by the record position imbalance could generate more volatility than average.
Next, we've plotted the equity curve using this model's walk-forward results. Remember, the Monte Carlo statistics provide a much better average expectation.
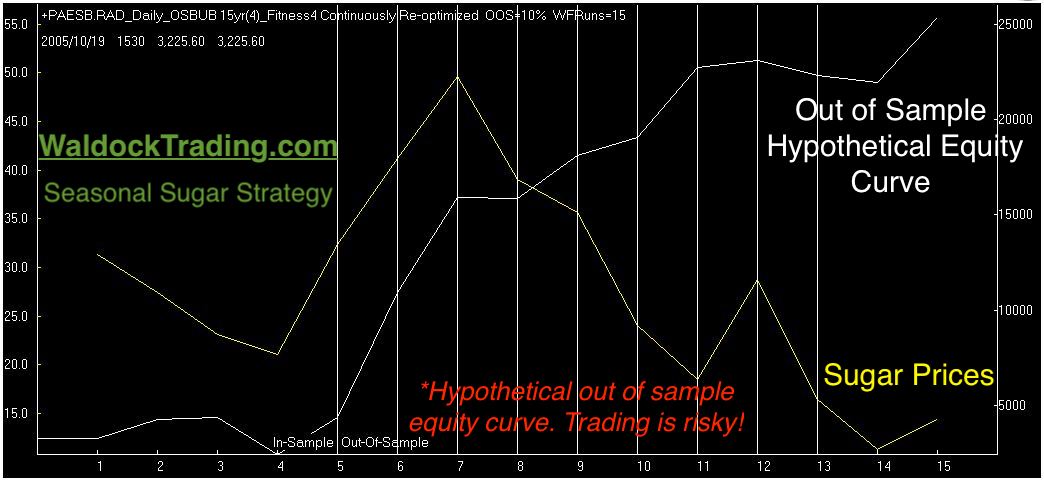
This is no guarantee of future profits.
Monte Carlo testing is very helpful when sample sizes are small, like annual occurrences.
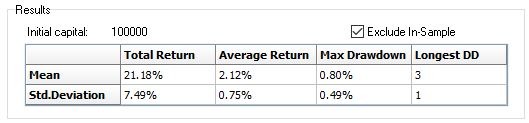
Monte Carlo testing provides 1,000 samples, rather than 15. We use ratio adjusted data so that we can work the Monte Carlo percentage results back into current prices. You can see that our expected trade profit is 2.12% +/- 1 standard deviation. This gives us an expected range between 1.37% and 2.87% or, 16 - 34 points, which equals $179.20 - $380.80. Bear in mind that I believe the current record imbalance could create a much larger swing the average historical testing would suggest. Finally, based on current volatility, we'll be risking approximately 50 points, $560.
Follow along to be notified of the entry date, exit date, stop losses, and position updates. We also expect to have a cocoa trade coming later in the month, as well.