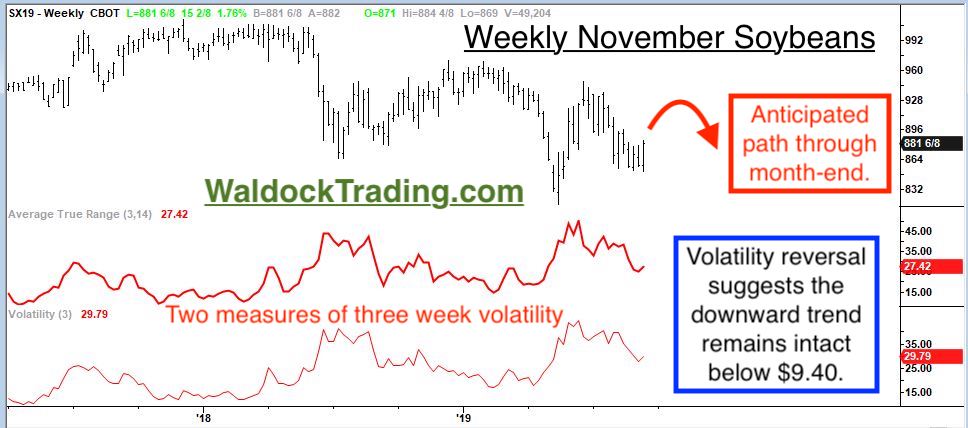
We shied away from the recent seasonal short trade in corn, citing already depressed prices and trade war uncertainty. Soybeans have not fallen as much as corn, and current trade war optimism is generating a bid ahead of official trade talks in early October. We think this rally is a great candidate for our seasonal short selling opportunity in November soybeans.
First, let's look at the weekly chart along with the market's current volatility. We've plotted two different measures of volatility to show you that they are roughly equal for the calculations we'll perform later on.
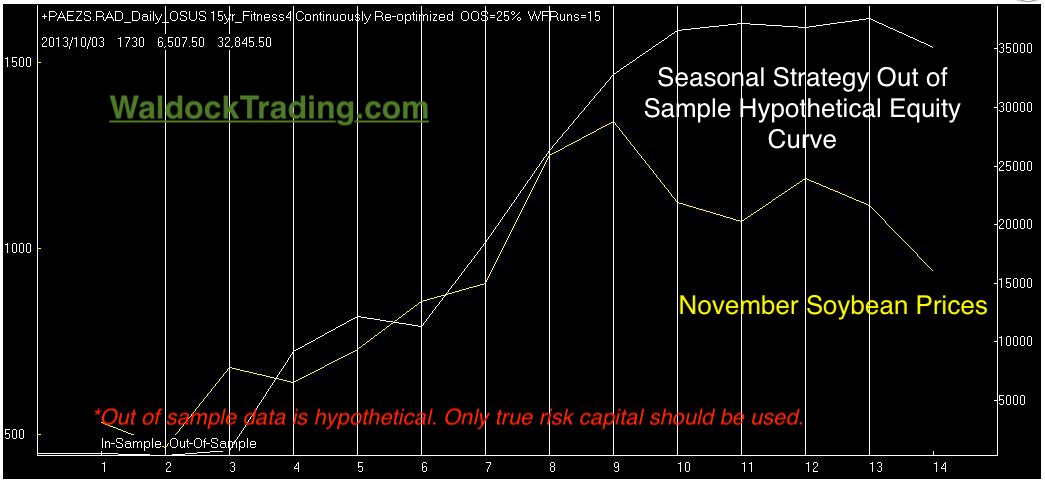
Our seasonal subscribers are sent the entry date, protective stop, stop updates, and exit time. Remember that the information below, though out of sample, is hypothetical. First, we'll look at the equity curve and performance reports. Then, we'll examine our protective stop placement methodology.
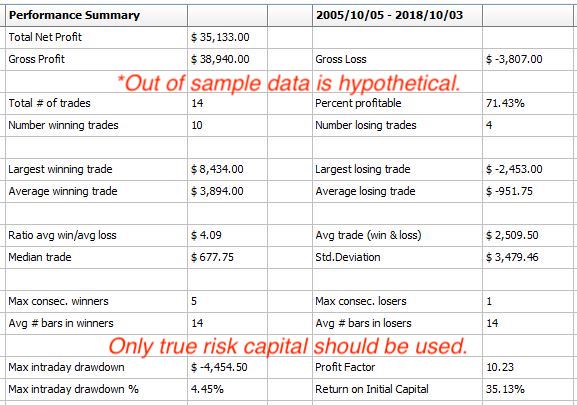
It's important to remember that performance reports like the one above, only provide a single stream of data. Monte Carlo testing allows us to mix up both the data and the signals to generate a much larger sample size. Monte Carlo testing is like running through history 1,000 times, employing different variable values, and summing the results.
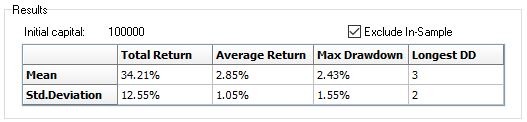
We can use the Monte Carlo analysis to create better expectations by helping to mitigate the sampling error issues associated with temporal data. We can deduce that the average max drawdown is 2.43%. Adding two standard deviations to account for 99% of all occurrences, gives us a bailout window equal to the entry price plus 5.53% or, $.4875 per contract. The difference equals a max cash loss disaster stop equivalent to $2,437.50 in your account.
We can also use Monte Carlo analysis to generate profit expectations. We expect (with a 71% degree of certainty) to make, on average, 2.85%. However, the majority of trades will range between 1.8% and 3.9%. The difference means we expect November soybeans to decline between $.36 and $.78. It's no wonder, numerically speaking, that the expected declines place the market's support at $8.50 and the low at $8.155 directly in its sights.
Stay tuned or, subscribe, for the entry, exit, and stop level updates.