

The recent rally in the copper market has attracted record selling pressure from commercial mining companies. Better information does make for better trading strategies. We'll explain the information circle at its highest levels, how it affects the futures market, and how you can use this information to help generate profitable swing trading opportunities in the commodity futures markets.
Copper prices are trading at their highest level in more than 18 months. The surge picked up steam on the election's outcome and now stands more than 15% higher than November 1st. The surge in prices has been fueled by speculative buying based on expected infrastructure renewals. In fact, large speculators set a new record net long position for the week ending December 9th. Not coincidentally, the week ending December 9th also marks the highwater mark for the recent rally. It follows the adage regarding the speculative traders being left holding the bag at the worst possible moments. This correlates well with their historically poor track record.
The speculators' poor track record is why we follow the actions of the commercial traders. We'll use Freeport McMoRan(FCX) as our commercial model since it is the number two copper producer in the world, and they are responsible for just under than 10% of the global output.
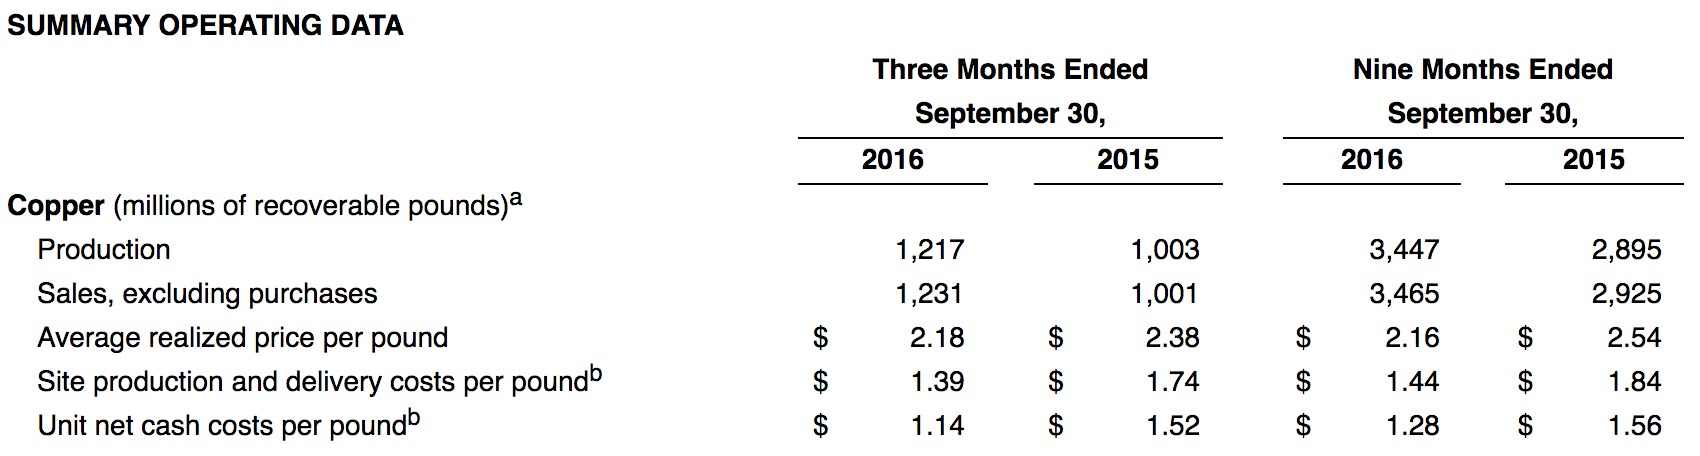
Every Fortune 500 company discloses their actions as well as their predictions to their shareholders. You can see that FCX sold 3,447,000,000 pounds of copper through the first nine months of 2016. Our guess is that their Q4 report, due out on January 25th shows strong forward sales as they hedge more their future production at the recently high prices.
We'll track their actions through the commercial trader category of the weekly Commitments of Traders(COT) report. This report separates and categorizes every holder of positions in the market above a given position size threshold. Consider that the copper futures contract is 25,000lbs. To hedge half of their intended production, they would have to sell nearly 67k forward futures contracts. Now, add in the fact Rio Tinto, Codelco, and other copper miners are thinking the same thing, and you begin to understand why we lean on them to support our trading ideas. See the chart below for the opposing actions of the commercial and speculative traders. Then, we'll explain part of the reason the commercial traders usually have the upper hand.
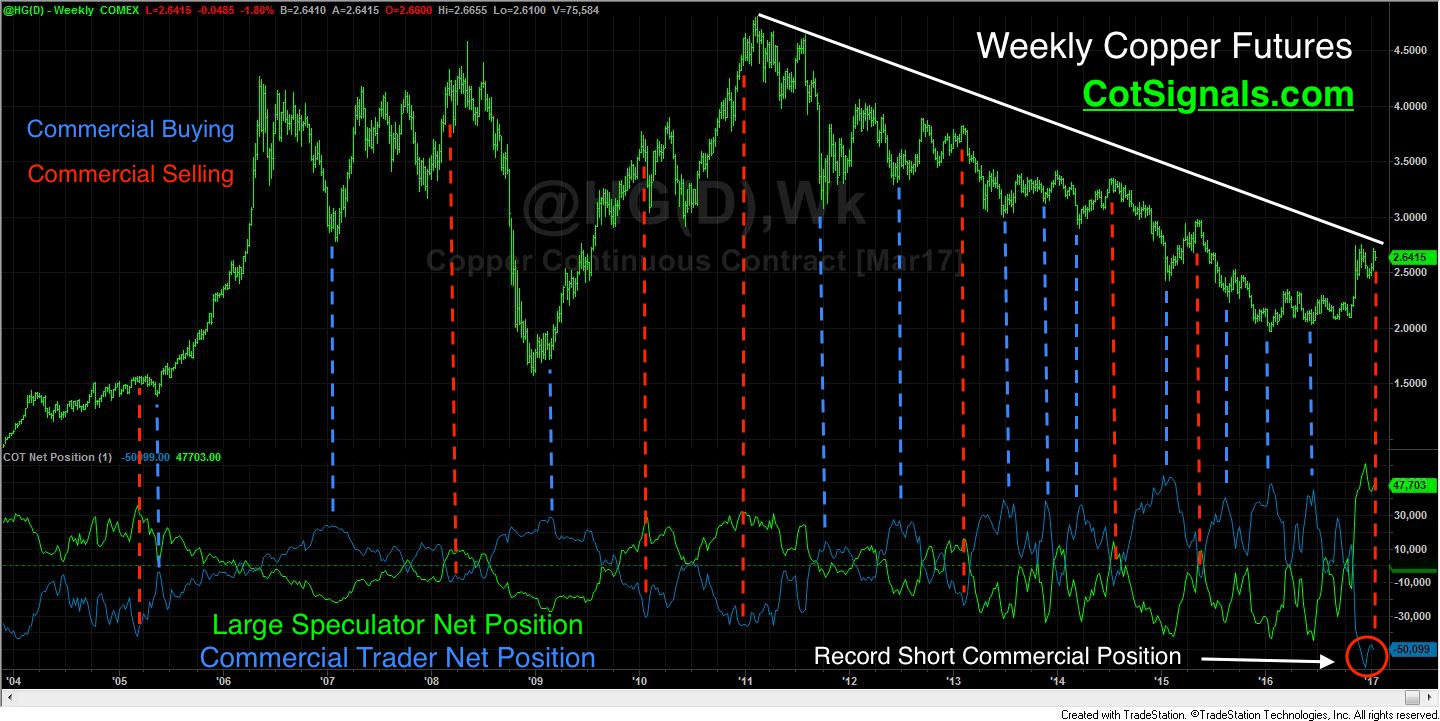
First, keep in mind that this is a weekly chart. The COT report provides the broad brush strokes upon which we hope to leave a little imprint. While they don't get every move right, they certainly catch the majority of the peaks and valleys. Commercial traders are value players. They trade within a band of perceived value at all times on both the buy and sell sides. Copper producers are always willing to sell some forward production on price spikes just as copper refiners are always willing to purchase raw materials at a discount. One of the keys to their success in the forward predicting of prices lies in the strength of their boards of directors.
![COT Free Trial[1] copy](https://waldocktrading.com/wp-content/uploads/2016/09/COT-Free-Trial1-copy.jpg) Carl Icahn owns just under 9% of FCX. His giant stake allowed him to negotiate two new board of director seats on FCX this past October. This ties in well with the economic backgrounds of Richard Adkerson of Arthur Andersen and Gerald Ford of Goldman and is reinforced by the cable ties of John Madonna of AT&T's board and Frances Townsend of Western Union and Scientific Games Inc. While copper futures are approximately 20% higher since the Icahn announcement, FCX is up more than 50%. Guidance matters.
Carl Icahn owns just under 9% of FCX. His giant stake allowed him to negotiate two new board of director seats on FCX this past October. This ties in well with the economic backgrounds of Richard Adkerson of Arthur Andersen and Gerald Ford of Goldman and is reinforced by the cable ties of John Madonna of AT&T's board and Frances Townsend of Western Union and Scientific Games Inc. While copper futures are approximately 20% higher since the Icahn announcement, FCX is up more than 50%. Guidance matters.
As a trader, we simply look for good places to sell when they're selling and good places to buy when they're buying. Their collective consensus of value is our primary buy/sell screen. The dashed lines on the chart represent our first screen of the market. We then distil the weekly data down to daily resolution. We monitor the daily situations for signs of market imbalances. When the proportions become lopsided in a market that is overextended, we begin to look for reversal opportunities based on the notion that the commercial traders will act upon the current price discrepancy and their actions will drive the market back towards its value area.
Please visit CotSignals.com for more information on our Commitments of Traders methodology as well as Free Trial of our discretionary nightly email covering all major domestic futures markets.


