Crude oil has been trading roughly sideways for more than two years now, between $40 and $80 per barrel. Recently, the market tested 2016's high near $58. We noted in several publications that this rally was bound to fail and that rallies above $55 per barrel should be sold. The purpose of this piece is not to pat ourselves on the back but rather to explain the battle that takes place in the markets between the speculators and the commercial traders and define the characteristics that put us on alert for major speculative washouts like we're seeing in the crude oil futures market.
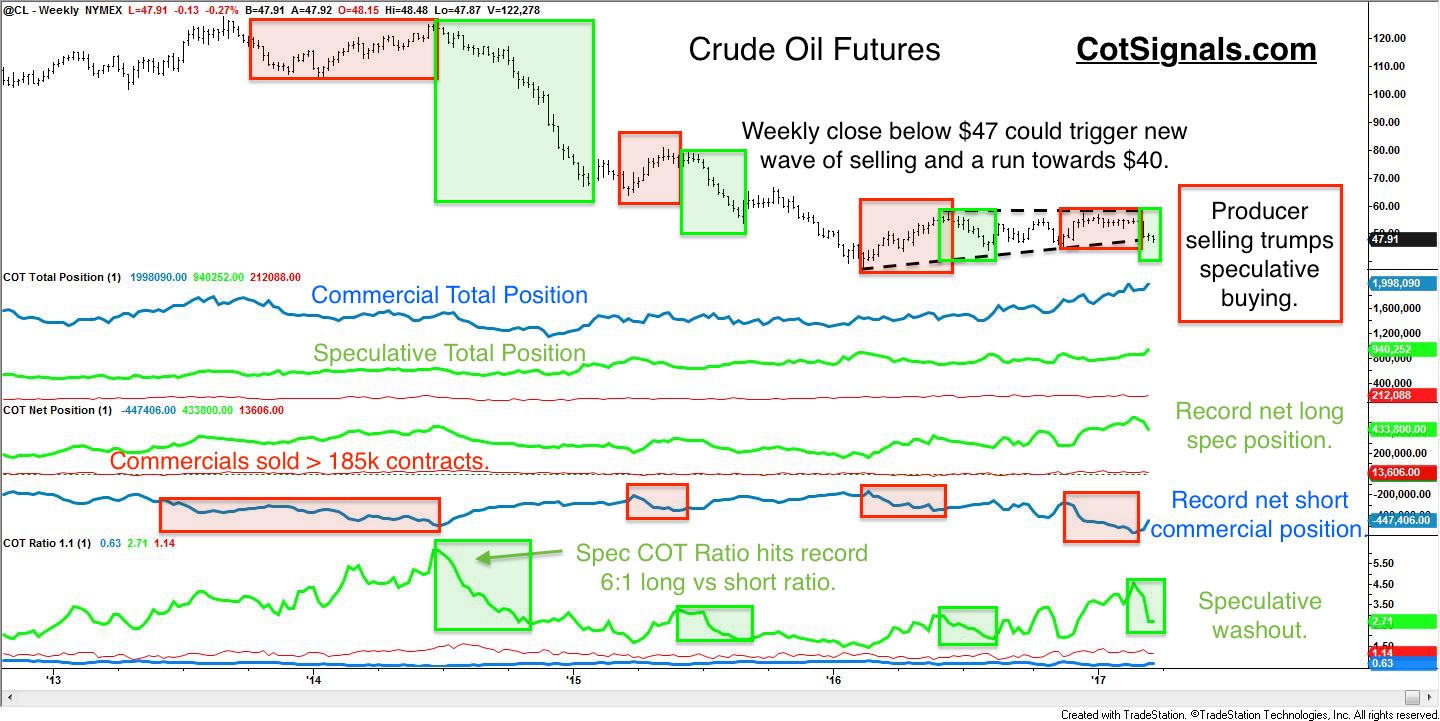
Bear with the boring part. We track the actions of the commercial and speculative traders through the weekly Commitments of Traders(COT) report. This report by the Commodity Futures Trading Commission(CFTC) allows us to track the net and total positions being carried by the respective trading groups. We then use this data to create our indicator, the COT Ratio. You'll see in the charts below that the bigger the speculative interest in a move, the more likely it is to fail. For example, in June of 2014, our COT Ratio set a record reading. This meant that the speculators had never been more collectively bullish. Remember, "peak oil?" The market "peaked" on June 27th of 2014, just shy of $125 per barrel and closed the year at $77.50 and continued falling all the way below $40 per barrel early last year. That is a speculative washout.
Looking at the weekly chart below, you'll see that I've highlighted the significant portions of the commercial selling. It's also important to understand that as the breakeven production price of crude oil declines through modern production technology and new reserves are proven, the pressure lies on the oil drillers to get their product sold at a profit. Many drillers were forced to cease production on the decline below $40 but, they're coming back with new and improved methods. The post-election oil rally met with new resistance as the drillers re-entered the market selling forward contracts at a record pace attempting to make up for lost revenues while protecting themselves from another downturn in oil prices.

Before we move to the daily chart, it's important to take a look at the technical action in the weekly chart above. Crude oil bottomed early in 2016, near $38 per barrel. The upward sloping trend line off that low now comes in around $47 per barrel. Crude oil volatility has declined as the market has risen from its low while being bound from above by commercial driller selling. The battle between the speculators trying to push the market higher appears to have climaxed. Speculative long liquidation over the last two weeks has dropped the COT Ratio from more than 4.5 to a closer to average 2.7. However, it is important to take into consideration the size of the net and total positions. The speculators could easily dump more than 100k contracts without disrupting the normal pace of their liquidations. A close below the upward sloping trend line at $47 per barrel could trigger this next wave of speculative liquidation. A close below the trend line should push the market down towards $40 per barrel and serve as a re-test of the February, '16 low.
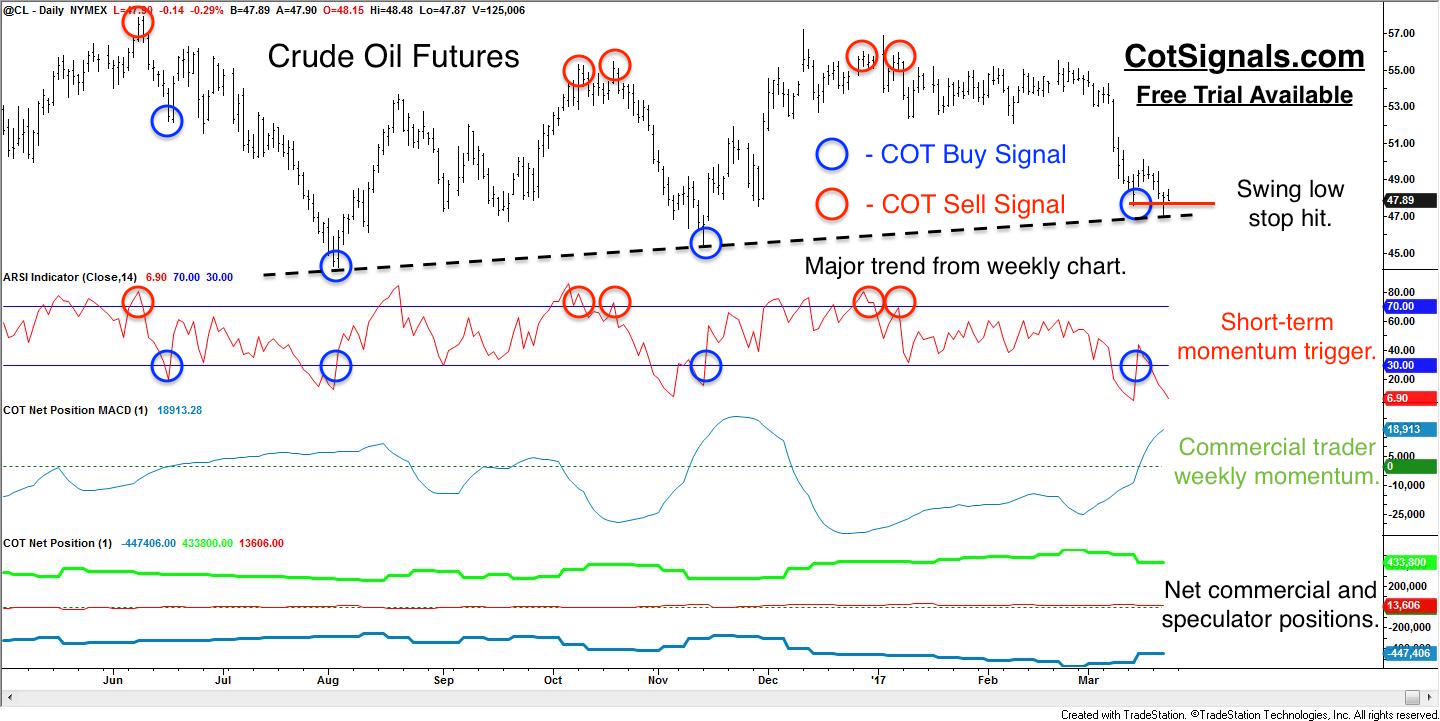
Shifting gears to the daily chart and the standard Commitments of Traders overlay we use in our nightly COT Signals email, we'll start with the third subgraph, which tracks commercial traders' momentum. The commercial traders' collective total position is usually about twice the size of the speculative position in the crude oil market. When the commercial traders collectively decide that their market is under or overvalued, they put their capital to work with drillers selling forward production and refiners buying futures to supply their crack operations. We want to be on the dominant side of value and strength. Therefore, we look for buying opportunities when their momentum is positive, and we look for selling opportunities when their momentum is negative.

This where the rubber meets the road. We use a short-term momentum indicator to determine overbought and oversold. Remember that speculative traders tend to have a "fools rush in" mentality. They are afraid of the market getting away from them. This leads to the positive, exponential correlation between the speculative traders' net position and a given market's price run. Their behavior is similar to chasing a hot manager in the equity markets. The market continues moving in the same direction until it runs out of speculative fuel and collapses of its own weight. The short-term momentum indicator helps determine when there may be enough fuel to generate a powerful enough reversal to trade. Recently, the market was overbought thanks to a record net long speculative position as shown in the bottom plot. This is more than enough fuel to force the market lower.
Finally, notice the last trade on the chart. This is the buy signal that went out last week. Our discretionary methodology always places a protective stop loss order at the recent swing high or, low. Our philosophy is value trading based on the commercial traders' consensus of prices. If we are right and the market has turned, we should have ample time to take profits as the speculators are flushed out by the market's retreat. We were wrong but, note that commercial traders' covering some of their record short positions has pushed their momentum onto the buy side. It will be interesting to see if the market will stabilize here, creating a favorable bounce to trade higher or, if the crude oil market is getting set for another leg lower.
There are times when the swing high or low may be too far away monetarily to suit the risk profile of your account. In those cases, don't take the trade. Twenty-five years of trading has proven one thing for certain; there's always another trade. Know your risk and trade accordingly.


