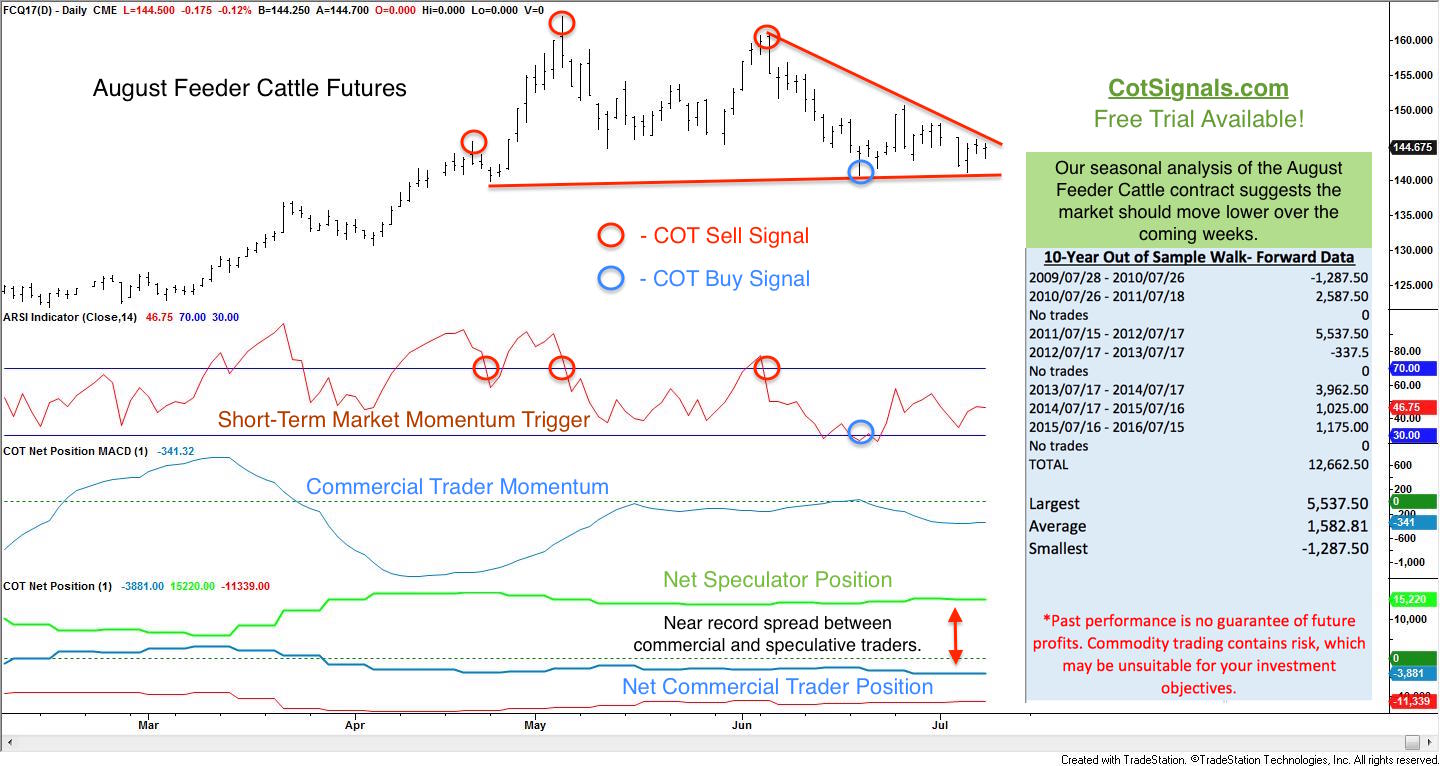
Commercial traders in the August feeder cattle futures have built up a near record short position ahead of this contract's typical seasonal weakness. When we combine these factors with the technical picture on the chart below, you'll see why we've already initiated short positions in this market.
We'll begin with the fundamentals via the Commodity Futures Trading Commission's (CFTC) weekly Commitment of Traders (COT) report. We use the commercial traders' actions to determine the professional outlook for a given market. These are the traders doing the hedging for companies like Tyson, McDonalds, ADM, etc. Not only do they have access to streams of information we can't imagine, but they are also among the most well-connected decision makers in the world. Consider that Richard Lenny, formerly of Information Resources, Inc., a market research firm, also sits on the boards of Hershey, Kraft, McDonalds, and others. Mr. Lenny is just one example of the cross-pollination among the Boards of Directors of companies at the highest echelons. The point is, we trust their big picture sense of where markets are heading.
Our research has shown that market conflicts between the commercial and speculative traders typically resolve in favor of the commercial traders' anticipated direction, and the current difference is near record setting territory. Speculative traders nearly matched their 2012 record long position earlier this year, and their current position is also just a whisker shy of record territory. While this indicates a market potentially out of gas on its own, the current commercial position adds weight to the short selling argument. Commercial traders now hold their most concentrated net short position since March of 2012. This should be the equivalent of a flashing yellow light for remaining bulls.
Commercial traders are hedgers. We, however, are not. Therefore, while commercial traders take actions to ensure their profitability over the coming season, we need to think more short-term. This brings us to the tools used to move from a general market outlook via the COT report to an actual trading plan. The market compression and waning momentum are illustrated in the chart, below. Note that the May high nearly reaches the .618 Fibonacci level of the market's broader context from the 2014 high through last October's low on the back adjusted chart. This also makes an excellent point about the difference between back adjusted charts vs. their real contract counterparts. The November 2014 feeder cattle contract high was $245.75 and, the January 2017 contract low was $110.65. In actual contract terms, we haven't even reached the 50% retracement level, yet. That being said, commercial traders are expected to push the market through the support now coming in around $140.50 in the August contract. A close below here sets off the larger bearish pattern. Typically, the price action will include a rapid fall as speculators take their losses and exit their long positions.

We'll close with a bit on the August feeder cattle market's seasonality. We perform seasonal analysis cross-referenced with the historical contracts trading at the time. This provides a much more accurate sample than back-adjusted contracts and the associated issues mentioned, above. The table contains the out of sample walk-forward results of this strategy over the last ten years on the actual contracts that were trading at the time. Using this data, we can see the consistent downward bias in feeder cattle following the 4th of July holiday.
Trading is hard. There are many details that can be missed and potholes to stumble across. Stack the odds in your favor using as many quantifiable and unrelated methods as possible. We're already short August feeder cattle, and we expect them to remain below $149 on their way towards the low $130's over the next couple of weeks.


