
The equity markets have been THE place to be for capital appreciation over the last few years. Last year saw the Dow Jones under perform with a 9.6% return compared to the S&P 500 at 13% and the Nasdaq 100 at a whopping 19%. In spite of the impressive returns provided by the stock index futures last year, there were still periods of flatness and even outright declines. In fact, the Nasdaq had a decline of more than 10% from peak to trough at one point last year, in spite of its 19% return for the calendar year. This week, we'll discuss a method of applying the commercial traders data from the weekly CFTC Commitment of Traders reports to the equity markets in an attempt to preserve profits gained on the long side of the markets as well as profiting from forecasted declines.
First, some background on the data. The Commodity Futures Trading Commission (CFTC) publishes a weekly report of the actions taken by the markets' primary groups of traders. These are the Large Speculators, Small Speculators and the Commercial Traders. The Large Speculators include index fund traders and commodity trading advisers. The small speculators are exactly what they sound like. Finally, the commercial traders are the giant managers using the equity index futures to control the leverage in an underlying equity strategy. They adjust their exposure to market movement through the use of the futures due to their leverage and ease of execution. It is much easier to add or subtract roughly $100,000 of S&P 500 equity through a single contract in the futures market than it is to properly size and execute the 500 stock transactions individually.
This week focuses on the effects of the commercial traders' actions in the equity index markets. The following charts track the individual equity index futures markets in the upper pane, the commercial traders' net position in the middle and the momentum of the commercial traders' collective actions in the bottom pane. This is the primary screen we start all of our futures market analysis with at COTSignals. The goal is to align our own trades with the collective sentiment of the commercial traders. Looking for buy signals when they're buying and sell signals when they're selling.
The S&P 500 futures are by far the deepest and most liquid of the stock index futures with more than 2.8 million in open interest for a total value of nearly $300 billion dollars. The Dow futures have an open interest of less than 12,000 for a total equity value around $640 million. Finally, the Nasdaq 100 futures' open interest stands at nearly 350,000 and has a cash value of $30.5 billion. The ultra deep liquidity of the S&P 500 futures leads to the fewest periods of negative commercial trader momentum as can be seen in the chart below. As the most stable of the indices, if the minimum action of going flat is taken, the portfolio makes three trades and avoids the downside pressure while still capturing the year's gains.

As expected, the thinner the market becomes, the more trading signals are generated. Moving next to the Nasdaq 100 futures you can see that there were four shifts in commercial trader momentum in 2014. Once again, simply being out of the market would've eliminated much of the downside risk. Trading more aggressively provides the basis for the outright trading signals that comprise the nightly discretionary service. The question simply comes down to trading style. Long only portfolios should have methods that signal when to lighten up or flatten out while swing traders will want to capture as much of a market's predicted movement as their strategy allows.

This brings us to our current situation. The Nasdaq 100 futures have just signaled a shift towards negative commercial traders' bias. We would use this as an opportune moment to look at equity protection strategies in the tech heavy Nasdaq. Simply being out of the market during these periods last year would have saved just a bit over the course of the year but, the peace of mind provided by being flat the market during some of last year's declines would've been priceless.

Finally, we move to the smallest of the stock futures markets, the Dow. Like the Nasdaq, this has created yet more trading opportunities. Not to mention, the small contract size makes this an appealing choice for new futures traders or the owners of fully mature old-school equity portfolios looking to hedge their earning histories using modern tools and methods. One Dow futures contract is worth approximately $80,000 and requires a little more than 10% to be held as cash margin in a futures account.

Once again, the power of this method is obvious. Exiting the market during these periods would've added to the market's total return as well as avoiding several periods of sleepless nights. We've just entered a new period of negative commercial momentum in the Dow and Nasdaq futures. Time to check the sleep patterns.
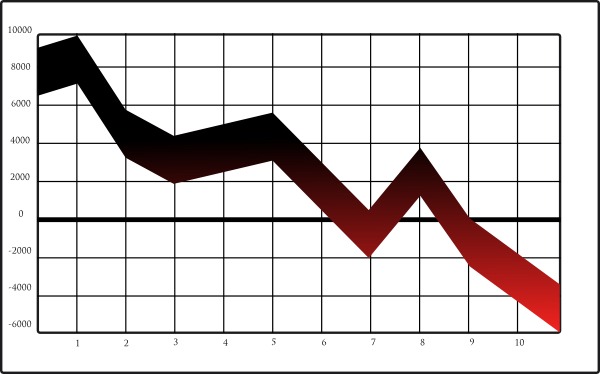
Finally,the statistics below show just how much market pain and agony can be avoided simply by following the collective actions of those who move the Billion$.

The CFTC weekly Commitment of Traders reports can be an invaluable tool in the analysis of stock index futures and tracing the derivative to the root, the stock indices as a whole. The recent selling by the commercial traders in the Nasdaq and Dow futures has shifted their momentum into negative territory. Meanwhile, the S&P 500 continues to plow along. Quantitative analysis like this eliminates the guesswork involved in explaining and acting on the individual market's divergence from the broader market as a whole or trying to separate the rhetoric from the newsworthy.


