
The following seasonal trading model, based upon growing sugar demand in the US through the holiday season, is ready for deployment in the commodity markets via the March sugar futures contract or the Teucrium fund, "CANE."
This model capitalizes on the following factors:
- Sugar demand in the US picks up as we head into Halloween, Thanksgiving and Christmas.
- The sugar futures market expiration cycle shifts from October 23 to March 24.
The Setup:
Companies sweetening our holidays tend to pre-purchase their supplies in order to better forecast their cashflow. Many of these supplies are purchased as October and March commodity futures contracts. The expiration of the October contract forces the execution new purchases in the March contract. When we combine the timing of these purchases with domestic demand increase, we create a consistently exploitable and stable annual window of opportunity.
Seasonal Sugar Trading Model Stability:
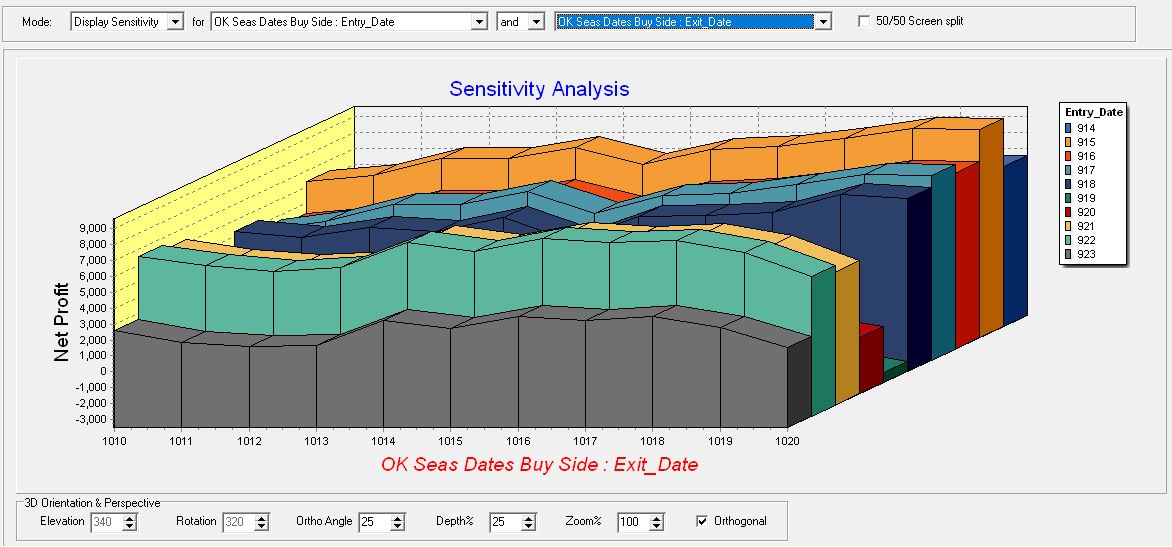
Determining a repeatable window of opportunity is one thing but, turning an annual event into a legitimate opportunity requires more thorough analysis. Below, you'll see the profitability plots across all entry and exit dates tested over the last 15 years. As you can see, we've clearly identified a market bias.
Monte Carlo Analysis:
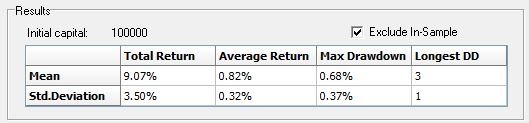
Monte Carlo analysis is one of the tests we run to ensure that we're seeing an historically repeatable pattern by shuffling the data and reorganizing it to help prevent the computer from fitting our equation to the sugar market's history. The results are displayed in terms of statistical distribution.
I also use this process to normalize historical data with current market prices so that we can build out our model for the trade ahead.
Here's how to read the Monte Carlo report through the lens of current market values.
According to the Monte Carlo report, the average return is .82% on $100,000. In other words, the average statistical win over 1000's of tests is $820. Our testing is based on the sugar futures market which is currently trading around $.27 per pound. Sugar futures trade at $11.20 per point. Therefore, $820 divided by $11.20 gives us an expected seasonal effect of $.73 per pound or, 3.5% over our expected holding period.
Performance Results:
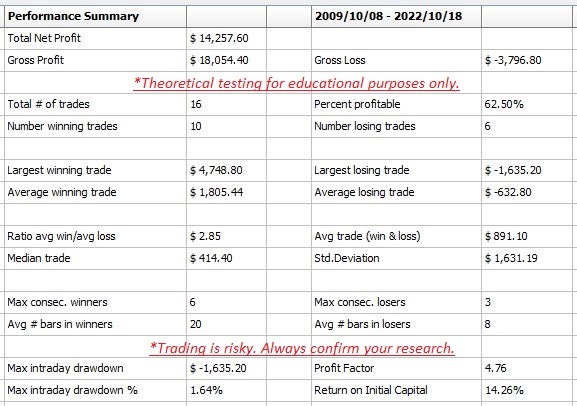
The standard timeline view of our model's performance is below. Remember that a single timeline, even 15 years long, is still just a single timeline. We chop up the data into 1000's of combinations to avoid curve fitting. This is why the out of sample performance results are typically better in the historical performance report than the Monte Carlo results. In this case, the historical timeline is about 10% more profitable over the 15 year period than would be statistically expected.
Remember that we build a new model every year for the coming trades. Therefore, any historical performance report will be theoretical. Please, follow along if you'd like to keep up with our current seasonal models. Below, you'll see the equity curve of this strategy plotted against the sugar market's historical prices.
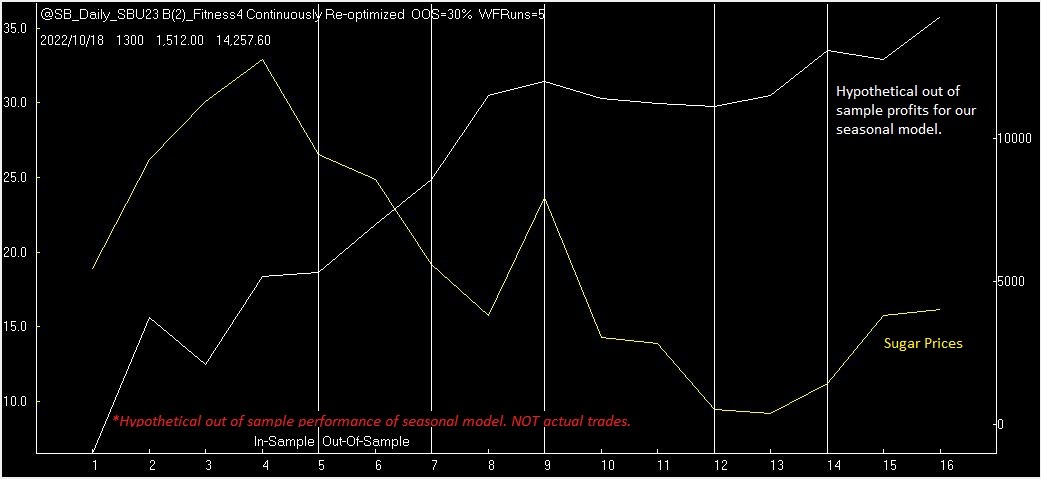
Seasonal Sugar Strategy Equity Curve:
There are two things to notice on the equity curve, below. First, the vertical lines beginning with the fifth trade represent out of sample data. In other words, the algorithm hit these trades blind. Secondly, the yellow line represents the underlying price of sugar over the last 15 years. Note that the strategy was profitable over half of the time even during sugar's downward trend. This is also a good test of risk management that we are able to hold our head above water even through the market's declines.
Execution:
Tomorrow, (Friday, 9/22) will most likely be our entry day. What you're reviewing is basically our weekly preview for any trade we may have coming up. If we have a trade, we will always follow up with an ACTION EMAIL. I will only bother you during the week if there's action to be taken.
Currently, the March of 2024 sugar contract is trading just over $.27 per pound. At this level, we'll be risking about 40 points or, $460 in the futures market. Those of you trading the ETF - CANE, should limit risk to 2% of the initial investment.
On average at these prices, we expect the trade to return about 72 points or, $800 per contract in the futures market. those in CANE should look for a rally of about 3.5% on the invested amount. We intend to hold this trade for approximately 20 days. While that may not sound like much, it's an annual return above 60%.
As always, I'll follow up once we've entered to ensure the protective stop loss orders and profit targets are in place.


