My seasonal Treasury Bond trading strategy is a bit similar to the Farmer's Insurance commercials. "We know a thing or two, because we've seen a thing or two." I focus on recurring seasonal events and that's how I "know" what's coming, and the pending setup in the Treasury Bond market has been one of the more stable seasonal trading opportunities over the last 15 years.
The Seasonal Trading Setup:
The Treasury Bond market tends to fall during the month of September ahead of the Federal Open Market Committee's (FOMC) meeting ending on the 21st. Simply put, companies and individuals begin to increase their cash on hand as we head toward year-end expenses and policy unknowns. This holds true for corporations raising cash for year-end bonuses and tax liabilities just as it does for us as individuals heading into the holiday season.
Seasonal Trading Method:
Now that we've established a premise, let's look at the market action. First, it is important to understand that seasonality only provides a single timeline of data. Looking back at the last 15 years only provides us with 15 opportunities to split the data between in and out of sample data to generate a statistically valid model. Therefore, we use multiple forms of walk-forward optimization to artificially increase the sample size while simultaneously randomizing the inputs. The sum of expectations for our seasonal treasury bond trading are shown below in Tradestation's cluster analysis. This method varies the entry dates and holding period along with the sample size and the number of runs simultaneously. The key to this step is determining the stability of the seasonal Treasury Bond data. As you'll see below, the data is profitable across all but one of the possibilities tested.

Trade Risk:
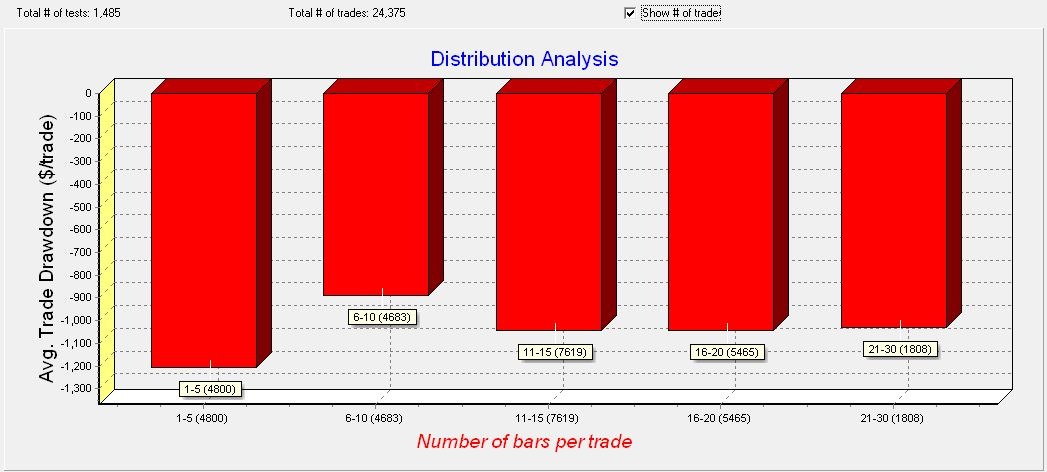
The information above tells us that we've found a repeatable, stable market inefficiency that we can exploit. Our next step is to quantify the magnitude of the movement we expect to see and determine if the risk to reward ratio makes this a trade worth taking. I do this by analyzing maximum adverse excursion. More simply, I want to know what the normal and extreme movement against me might be. Looking at the graph below, you can see that most of the volatility comes within the first five days of the trade. The second most volatile period is from days 21-30 which makes sense since the FOMC announces the results of their meeting towards the third week of the month.

This graph plots the movement against us in dollar terms, which must be translated into percentages inline with the corresponding market prices of the historical and hypothetical trade data. This is the only way we can compare prices equally across time. After all, comparing price movement from the record high in 2020 is far different from the price action we saw just 10 years ago when Treasuries prices were approximately half their 2020 values. Currently, December Treasury Bond futures are trading around 120, compared to their 2020 high over 180. This will be easier to visualize in the next chart.

Each slice of data represents a different max loss value, ranging from .005% through 3%. Net profit is listed in the elevation (z axis) of the chart along with the number of days in the position across the horizontal line (x axis). As you can see, maximum profitability for this seasonal trading strategy lies between 9-12 days and we can achieve maximum profitability while risking approximately one percent of the entry price. We use Monte Carlo analysis to extrapolate this behavior to current market prices and create a risk to reward profile.

Seasonal Strategy Profit Potential:
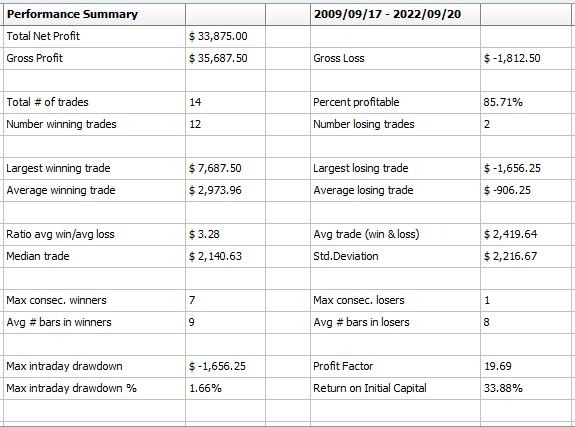
The key to interpreting the Monte Carlo results is understanding that this performance is based on a $100k account. You certainly don't need anything like that much capital for the trade. It just makes the math easier. The average return is 2.45% or, $2,450. The max drawdown is 1.39% or, $1,390. Adding in the standard deviation across the bottom row helps create an expected performance envelope. What we're looking for is the character of the move over a large number of observations. The average return is 2.45% with a standard deviation of 1.37%. Utilizing a standard distribution we can determine that we expect to make $2,450 +/- $1,370 on roughly two thirds of our trades while risking $1,390 +/- $1,210. This is a more accurate description than the performance report below, which is based on a single timeline containing a limited number of observations. Using a standard performance report like the one below is how individuals get stuck using curve fit models that don't hold up in the future, which is why we perform so much additional testing.

These hypothetical results provide some analytical detail but for the most part, they are subjected to the vagaries of small sample size.
Now, let's move on to the tradable instruments that will allow us to capitalize on the expected downward movement in Treasury Bonds during the coming month. First, it's important to note that I intend to initiate this trade form the "short" side of the market. This means that I expect the market to decline therefore, my market entry is a "short sale." In the December Treasury Bond futures market, which I trade, I'll simply sell the December Treasury Bond futures around September 5th to create a new short position. For those of you who don't trade futures, there are several Exchange Traded Funds that will allow you to take a short position in order to profit from the anticipated decline. The key is to look for "Inverse" ETF's. This sounds a little wonky but these are ETF's that you buy just like a stock or mutual fund. The difference is that these ETF's are designed to profit from market declines in the underlying instrument, rather than increases in price.
The list below is by no means comprehensive and I have absolutely no affiliation with any of the funds' providers but, this list is a good starting point. Note the "Tandem/Inverse" column tells you whether the fund trades in the same or opposite direction as the underlying market. In this case, you're looking for an "Inverse" fund. Secondly, note the "Leverage" column. Many financial instruments use leverage. The use of leverage allows you to capture a bigger return or loss than you would incur in a 1:1 situation like stock ownership. The most important concept to understand with leverage is that its employment can cause you to lose more than you have in your account. In other words, if you pick a 3x fund but don't allow 3x movement, you could be forced out of your position before the trade has a chance to play out.
Tradable Markets:
| Market | Company | Symbol | Tandem/Inverse | Net Assets (Mil) | Leverage |
| Long Bond | Direxion | TMV | Inverse | 306 | Yes 3x |
| Long Bond | Direxion | TMF | Tandem | 2,470 | Yes 3x |
| Long Bond | iShares | TLT | Tandem | 38,614 | No |
| Long Bond | State Street Advisors | SPTL | Tandem | 6,642 | No |
| Long Bond | ProShares Ultra Short 2x | TBT | Inverse | 378 | Yes 2x |
| Long Bond | ProShares Short | TBF | Inverse | 193 | No |
| Long Bond | ProShares Ultra Short 3x | TTT | Inverse | 224 | Yes 3x |
As you can see, there are several non-commodity account ETF's from which to choose. The last point to remember when using ETF's rather than commodity futures is that you have to monitor the price of the ETF to determine if the loss level has been breached. The commodity markets have what's called a, "stop-loss order." This is a resting order that gets triggered when a market moves a certain amount against you. In this case, I'll place my protective buy stop 1% above my short entry point. For example, if I sell the December Treasury Bond futures at 120, I'll place my protective buy stop at 121.20. However, since the Treasuries trade in 32nd's, I'll have to convert .2 into 32nd's which is about 6.5 32nd's or, a price of 121^6.5. This is read as a buy stop at 121 and 6.5 thirty seconds.
Those of you trading ETF's will simply watch the decimalized price boundary of 121.20 in the December Treasury Bond futures then, take the appropriate action in the market you're trading.
The Bottom Line:
Some of the profit and loss projections are as follows:
No leverage (TBF) - 1:1 ratio. Expect to risk about 1.2% of the allocation while expecting a return between 1.08% and 3.82% on the invested amount within the 10-12 day window of opportunity.
Double leverage (TBT) - 2:1 ratio. Expect to risk about 2.4% of the allocation while expecting a return between 2.16% and 7.64% on the invested amount within the 10-12 day window of opportunity.
Triple leverage (TMV) - 3:1 ratio. Expect to risk about 3.6% of the allocation while expecting a return between 3.24% and 11.46% on the invested amount within the 10-12 day window of opportunity.
30yr Treasury Bond Futures (USZ23) - 20:1 (roughly) ratio. Exchange traded futures are some of the most highly leveraged financial instruments available and should only be traded with proper knowledge of risk and guidance. I'll risk approximately $1,300 to per contract with the expectations of making somewhere between $1,100 and $3,820.
Look for another email when the market finally triggers our entry.
Best, Andy.


