The sugar market is as international as markets get. The USDA states that the top sugar producers are Brazil, India, European Union, China, Thailand, and the United States. This covers every continent but Antarctica. The global nature of the sugar market's top producers requires the simultaneous processing of several variables as unfavorable weather events in one region may be offset by greater yields elsewhere. Of course, the weather is only one of the variables. The producers listed above each do business in their respective domestic currencies. This creates currency and interest rate risk within each production center as well. Therefore, it would be very helpful to have input from global Fortune 500 companies like Nestle, McDonald's, Kraft-Heinz, Hershey's, Nabisco and others in formulating our price forecasts but, since we can't sit in on ConAgra's(CAG) board meetings, we'll have to track their collective thoughts through their actions in the sugar futures market. This week, we'll use ConAgra as a proxy for how the futures markets work and more specifically, how we can track the actions of companies like ConAgra and the others in the futures markets and put this information to use in our own futures trading strategy.
First, let's look at the board of directors for ConAgra. Their board is made up of 11 members. Seven of whom have direct connections to global commodity or financial companies. Don't get the wrong idea. This is not a witch hunt, and I am in no way implying any wrongdoing. Far from it, given the opportunity, I'd love to have their input. Corporate boards of directors are made up of some of the brightest and most well-connected people in their respective fields. This is why their opinions are valued in the first place. Consider Thomas Dickson, who was added just last year after retiring as CEO of Harris Teeter Supermarkets just as Bradley Alford is the former CEO of Nestle or, Richard Lenny who currently sits on the board of McDonald's and is the former president of Hershey's and was VP at Kraft. Each company's board has its own makeup, strengths, and weaknesses but, collectively, the boards of directors of commodity based companies have an understanding and connectedness to the broad market that consistently places them in the right positions at the right times.
Now, let's look at ConAgra's 3rd quarter report, and we'll see explain how the cash business of growing and processing commodities affects the futures market. Better yet, how we can use the big companies' actions to forecast price movement in the underlying futures market. Pages 15-16 of their Q3 report provide the details of their derivative transactions in both commodity and forex contracts. Rather than bore you with the particulars of the filing, we'll quote their closing synopsis on the commodity and derivative section.
"As of November 27, 2016, our open commodity contracts had a notional value (defined as notional quantity times market value per notional quantity unit) of $62.0 million and $19.0 million for purchase and sales contracts, respectively. As of May 29, 2016, our open commodity contracts had a notional value of $74.7 million and $41.5 million for purchase and sales contracts, respectively. The notional amount of our foreign currency forward and cross currency swap contracts as of November 27, 2016 and May 29, 2016 was $112.4 million and $112.9 million, respectively.
We enter into certain commodity, interest rate, and foreign exchange derivatives with a diversified group of counterparties. We continually monitor our positions and the credit ratings of the counterparties involved and limit the amount of credit exposure to any one party. These transactions may expose us to potential losses due to the risk of nonperformance by these counterparties. We have not incurred a material loss due to nonperformance in any period presented and do not expect to incur any such material loss. We also enter into futures and options transactions through various regulated exchanges.
At November 27, 2016, the maximum amount of loss due to the credit risk of the counterparties, had the counterparties failed to perform according to the terms of the contracts, was $23.4 million."
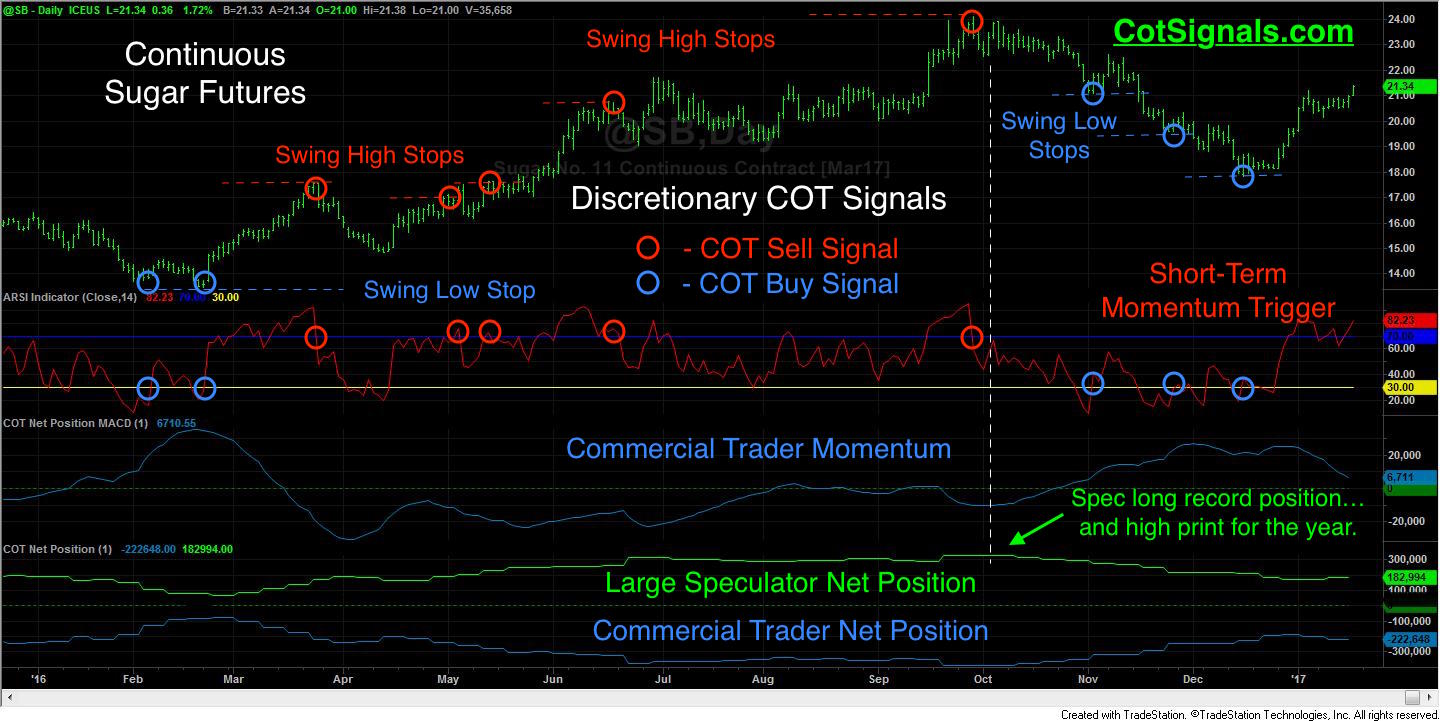
The actions of ConAgra, Nestle, Hershey's, etc show up in the weekly Commitments of Traders (COT) report published by the Commodity Futures Trading Commission (CFTC). There are two primary categories we're interested in; the commercial traders and the large speculators. The commercial traders category is made up of both the commodity producers who show up on the sell side and the commodity processors who show up on the buy side. Producers are attempting to sell their anticipated production at the highest possible price while the processors are trying to purchase raw commodity inventory at the lowest possible price. The difference between the Producers' collective selling and the processors' collective buying is plotted as the "Commercial Net position" in the chart below.

The chart above is the basis for the Discretionary COT Signals. I began using a nightly worksheet based on this three-step process nearly 15 years ago, and I still update it every night. This is a reversal methodology based on two primary factors. First, we look for an unsustainable market position imbalance between the commercial traders and the large speculators. The bigger the imbalance, the more dramatic the reversal usually is. Second, the market needs to be overextended and counter to the commercial traders' momentum. Let's examine the October reversal from the high. Commercial producers had been hedging their forward crop as the market rallied above $.23 per/lb. Their selling shifted our commercial trader momentum indicator into negative territory in mid-September. The rally pushed our short-term market momentum indicator into overbought territory and primed our short selling setup. The reversal from overbought triggered the October short sale and the swing high provided the protective stop placement point. Considering the large speculators set a new record long position, we knew that there were plenty of long positions to be stopped out of the market on its way back down and you can see the large trader net position decline accordingly as the market fell.
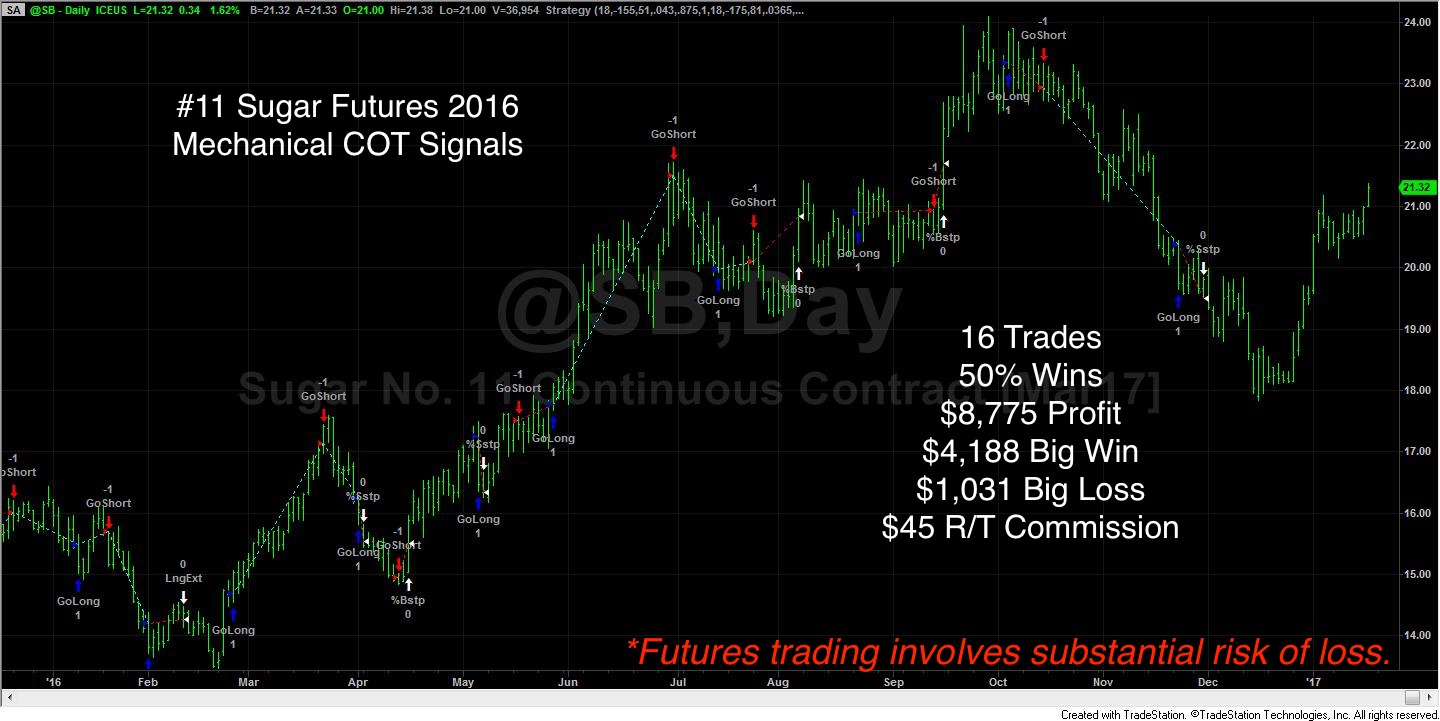
There are many peculiarities and subtle nuances to the COT reports, one of which is visible in the sugar chart, above. Notice that even at their most bullish point, the commercial trader net position remains in negative territory. This indicates that the degree of producers' forward selling is typically the dominant feature in this market. In fact, you have to go back to August of 2015 to find the last commercial traders' net long position. Interestingly enough, the commercial processor bid for raw materials halted a 5-year decline and still marks the lowest price traded since July of 2010. Apparently, the processors knew a bargain when they saw it. We developed a proprietary calculation to account for producer or processor bias in the commodity markets and incorporated into our mechanical commitments of traders program. You can see the results for 2016, below.

The mechanized version is the culmination of years of research and is what I trade for myself and my clients. We use this same methodology across all major domestic futures markets because the premise has generally held up. The bigger the conflict between the speculative traders' opinion of where a market is going versus the collective wisdom of the industry insiders and brightest business minds, the more significant the reversal when the speculators realize they're wrong.
Remember that risk control is everything so, swing trading suits our style. However, swing trading means giving up most of the home runs. The Commitment of Traders approach is value-based. The producers and processors have a collective range of prices at which they'd like to conduct business. The outer edges of this range, as defined by our short-term momentum indicator are, "the margin" at which economic choices are made. Therefore, we'll side with the commercial traders when a market is beyond its expected trading range and plan to take profits as prices normalize. Hopefully, this means buying low and selling high.


