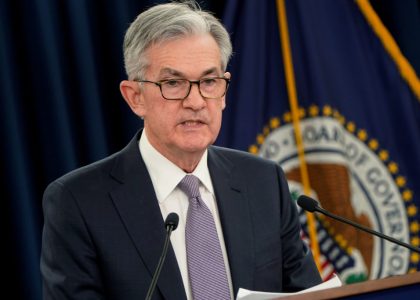
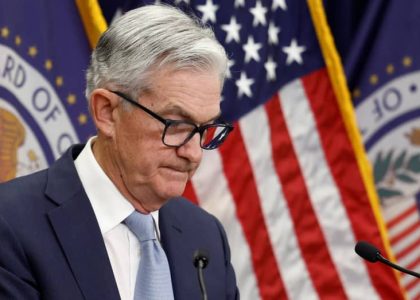
The interest rate sector has been going crazy trying to determine what to do since the Federal Reserve Board (FRB) chose not to raise rates at the September meeting. My email has been inundated by interest rate related mailings. The basic point of most them was, "Now that the Fed held steady, what corner have they backed themselves into?" Most of the boxing in is focused on the FRB's historical actions. I went back through 45 years of data to determine the scarcity of an October or, December rate hike along with Presidential election cycle analysis which isn't supposed to be linked to the FRB in any way, shape or, form (wink.) We'll also move through the individual futures charts to determine what the big money is suggesting with respect to FRB action, history be damned.
 One of the first emails I read stated that the Fed had, "never" raised rates in October because there is no press conference following the meeting. It made casual sense but required some firsthand sourcing to really get into the meat of the FRB's process. We found a total of nine October Federal Funds Rate adjustments going back to 1970. Two of them were higher. Given the importance of the signal the first rate hike will send, it seems odd that they would choose a meeting not scheduled to end with a press conference. October is not, however out of the question as there have only been three rate hikes in the last 45 years at the December meeting. These were in 2004 and 2005 along with one in 1980. The meeting schedule and calendar are not enough information to base a position on but it does begin to quantify the hyperbole coming from the cheerleaders on TV.
The point that really got me data diving was the issue of collusion between the Federal Reserve Board and the President of the United States as it relates to FRB action in an election year. This is NOT a stab at our current President. The point is simply that the party in power when rates are raised faces a tougher time at the election booth. Therefore, interest rate decisions during election years can be VERY touchy subjects. There were four occurrences in the last 45 years where interest rates were raised during an election year. Two of these were dead duck years, 1988 and 2000. The other two were 1980 and 1984. Interesting that Reagan both won an election, in part because of rate hikes during the Carter administration in 1980 but also retained the Presidency in 1984 amid rate hikes of his own regime.
History says the odds are against Janet Yellen raising rates this year yet, recent quotes suggests she still intends to pursue this strategy. Furthermore, New York Federal Reserve Bank President, William Dudley just stated that he expects the U.S. to reach the FRB's 2% inflation target next year, ahead of schedule. It appears that a battle royal is beginning to field its fighters as the talking heads on TV accuse the FRB of simply, "talking the market down." Meanwhile, as you'll see on the charts below, the commercial traders within the interest rate sector appear to be taking Janet Yellen at her word and preparing accordingly. Let's move to the charts, ordered by maturation length.

The Eurodollar futures may not look all that exciting at $25 per tick and a 5 tick range on a decent day but, it is one of the deepest interest rate markets in the world. Furthermore, due to the index itself, short sellers know that their losses will never exceed 100 minus the short sale price, plus commission. Therefore, the December Eurodollar futures which are trading at 99.60 are only 40 ticks away from the index ceiling of 100. Thus the maximum risk on this short sale is $2,000 plus commissions.

The 5-year Treasury Notes are the first of the interest rate futures products to display a formation we'll also see on the 10-year Treasury Notes. Commercial traders were big buyers at the June lows but appear to be losing faith in this market. The pace of this market typically precludes it from any major one way moves. Given the time this may need to process, we feel that a net commercial trader position as reported by the Commitment of Traders report below 165,000 net contracts could set off a flush to the upward sloping trend line that began at the June lows. This could support the market as the long end of the curve straightens itself out.

The 10-year Treasury Notes offer a bit clearer view as the trend in the commercial trader net position is clearly downwards. Just as importantly, the commercial traders have become sellers at the 124 level where they had been strong buyers as recently as July. This is exactly the type of large scale buying and selling taking place among the commercial traders that helps change price levels from support to resistance and vice versa. Commercial selling turning 124 into a resistance area would certainly put this market on the fast track to penetrate the double bottom and the lows for the year shortly thereafter.

Finally, moving to the 30-year Treasury Bonds reveals the ultimate conflict. Technically, there are a couple of things going on in the chart above. The largest pattern in place appears as a very large inverted head and shoulders bound by short-term support at the right shoulder and the neckline from the all-time highs. Historically, inverted head and shoulder patterns don't lead to new highs. In fact, near a market's high, it has a pretty good failure rate. Therefore, the small inverted head and shoulders pattern that has built up since the beginning of August may be more useful. Mathematically, the smaller pattern should push us up towards the neckline. From there, things could get interesting.
Over the next couple of months, the interest rate sector will be on full alert. History certainly puts the odds of a rate hike during the next two meetings as slim. Just remember that this is a decision, not a what if. Therefore, statistics are fairly useless in my opinion. The members of the FRB continue with their hawkish comments regarding both the October and December meetings. In fact, Dudley's remarks were downright optimistic about our economy. All of the lip service has led to indecision and that's when we refer to the collective wisdom of the commercial trader population. Based on the charts we've presented along with the FRB's historical actions, we'll go out on a limb and trade as if a rate raise is coming. After all, this what the commercial traders are suggesting as rare of an occurrence as an October or December cut may be.


